I’ve always been curious about how my tweets perform.
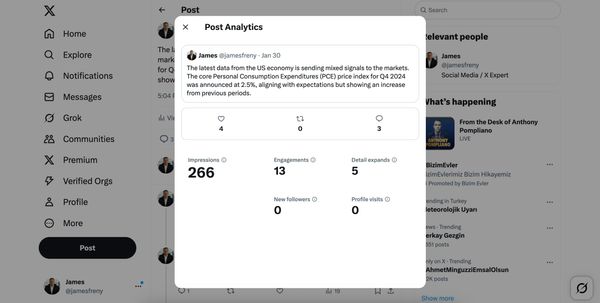
You can see basic numbers like likes, retweets, and views directly under each tweet. If you click on “View post analytics,” you get a few more stats — impressions, engagements, profile visits — but that’s pretty much it.
At some point, I wanted to go beyond that. I wanted to look back at all my tweets in one place, compare their performance, find the top ones, and figure out what works and what doesn’t.
But there was a problem.
Where did the Twitter Analytics page go?
Twitter used to have a full analytics dashboard — the kind where you could track impressions, engagement rates, link clicks, and more. It was really helpful for spotting trends and improving your content strategy.
When I went back to find it, it was gone.
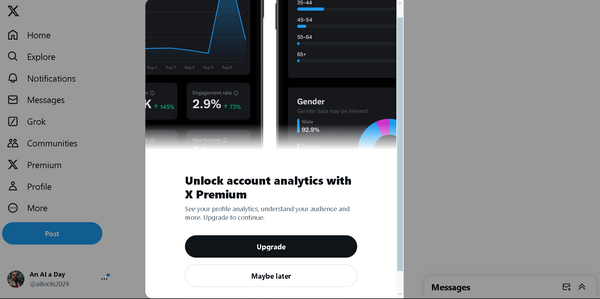
Now, Twitter says you need a Premium subscription to access tweet analytics in detail.
And honestly, I didn’t want to pay for Premium just to analyze my own tweets. Especially when all I needed was some straightforward data.
Circleboom Twitter: Best X Analytics Tools
I’ve been using Circleboom Twitter for a while now to manage my Twitter account — mostly for scheduling tweets and keeping things organized.
But when I decided to dive into tweet performance, I checked out the Post Analytics feature on Circleboom — and it was exactly what I needed.
It didn’t just fill the gap left by Twitter's analytics — it gave me more.
All Tweet Stats in One View
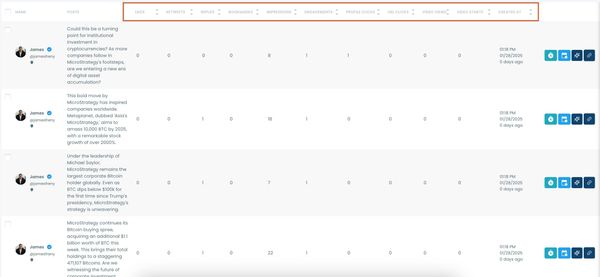
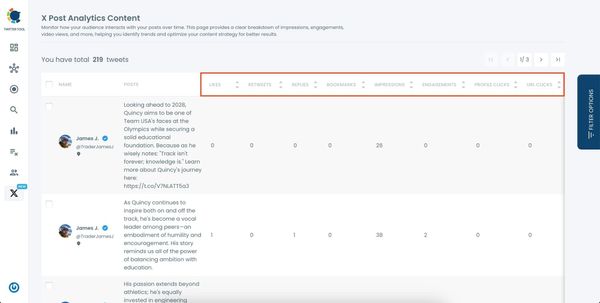
The dashboard listed every tweet I’d ever posted — over 1400 tweets — in a clean, sortable table.
For each tweet, I could instantly see: Likes, Retweets, Replies, Bookmarks, Impressions, Engagements, Profile Clicks, URL Clicks, Video Views, Creation Date.
No more clicking on each tweet to check performance. It was all there, and more detailed than Twitter ever showed.
Performance Charts Over Time
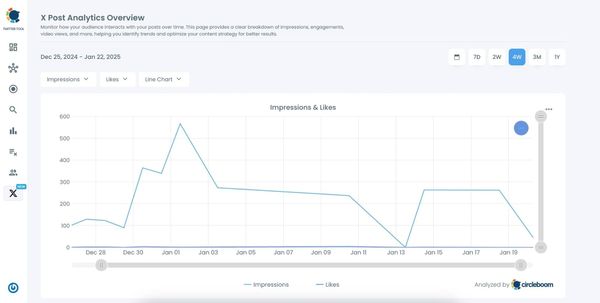
Circleboom also gives you a timeline chart that maps out your tweet impressions and likes over time.
I could switch between weeks, months, or even a whole year — which helped me clearly see when my content was performing well and when it was falling flat.
That kind of overview is really helpful for adjusting content strategy. I now know what topics and formats land best with my followers — and when to post for more engagement.
You can combine post analytics with Twitter Interest Targeting and create meaningful, hyper-targeted tweets that can produce more impressions and engagement!
You can hear what your followers are talking about!
Tools to Take Action on the Data
What makes Circleboom even more useful is that it doesn’t just stop at analytics. You can actually do something with the information.
For each tweet, you can:
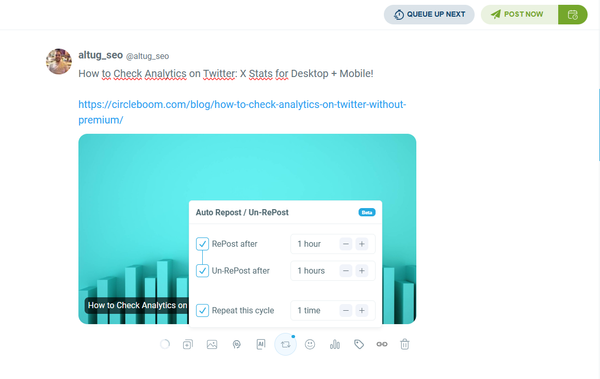
- Auto-Retweet it to bring back high-performing content.
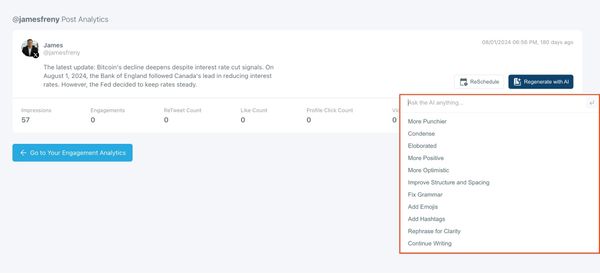
- Regenerate it with AI to improve the message or hook.
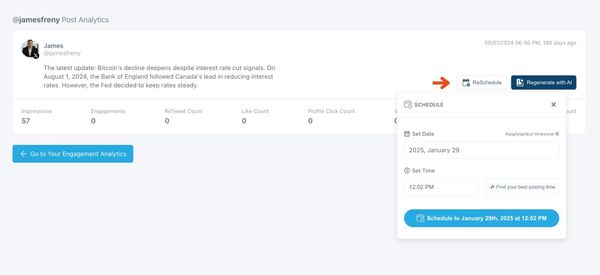
- Reschedule it for a better time based on past results.
So if a tweet had decent impressions but low engagement, I could rewrite it and give it another shot, instead of starting from scratch.
Here’s How I Use It (Step-by-Step)
If you want to analyze your tweets without paying for Twitter Premium, here’s how I use Circleboom to do it:
Step #1: Log In to Circleboom Twitter
Go to the Circleboom Twitter website and log in with your credentials. If you’re a new user, sign up—it’s quick and easy!
Step #2: Navigate to the Analytics Menu
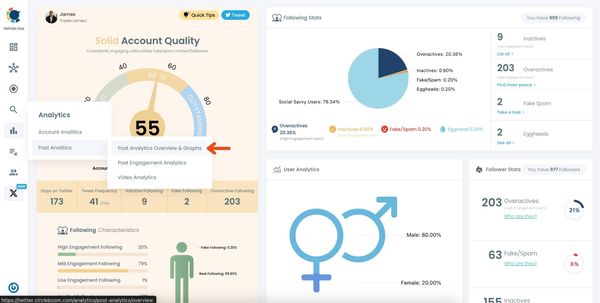
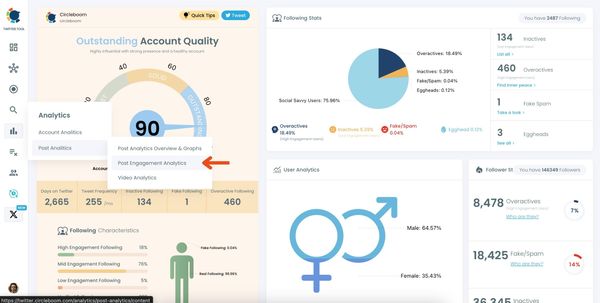
From the left-hand menu, click on the "Analytics" tab, then select "Post Analytics" from the dropdown.
Within Post Analytics, select the "Post Analytics Overview & Graphs" option.
Step #3: Analyze the Graphs
You'll see a line graph labeled "Impressions & Likes." This graph shows trends over time.
Adjust the time frame above the graph (e.g., 7D, 2W, 4W, 3M, 1Y) to view data from different periods.
Below or next to the graph, look for detailed metrics such as total impressions, likes, reposts, replies, and engagement figures.
These metrics often come with percentage changes indicating an increase or decrease compared to a previous period.
How to use Post Engagement Analytics:
Step #1: Navigate to the Analytics Menu
From the left-hand menu, click on the "Analytics" tab, then select "Post Analytics" from the dropdown.
Within Post Analytics, select the "Post Engagement Analytics" option.
Circleboom will display a detailed breakdown of your posts, including metrics like impressions, likes, retweets, replies, and more.
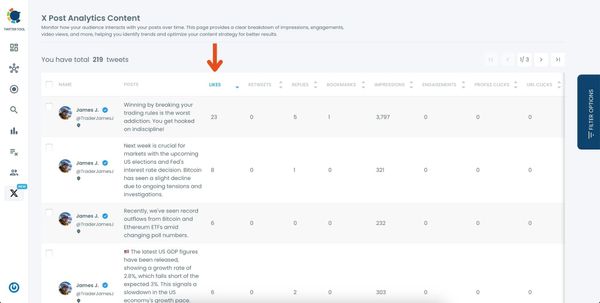
Step #2: Sort by Likes
Locate the "Likes" column in the content list. Click on the column heading, and Circleboom will automatically arrange your tweets from the highest to the lowest number of likes.
Step #3: Use Advanced Filters (Optional)
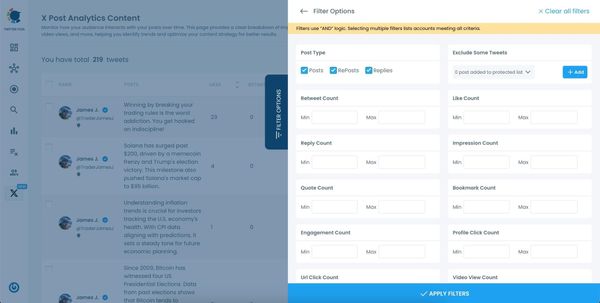
For a more focused analysis, click on the "Filter Options" button.
You can refine your search by metrics like date, engagement type, or other performance indicators to identify specific trends.
With these steps, you can uncover insights that help refine your Twitter strategy and boost engagement. Circleboom made it super easy to check analytics on Twitter!
Final Thoughts
It’s frustrating that Twitter wants you to pay for access to your own data.
But if you’re already managing your account with Circleboom like I am, you don’t need to.
The Post Analytics feature is detailed, actionable, and way more helpful than what Twitter offers — even with a Premium subscription.
If you’re serious about improving your Twitter content, tracking your performance, and making smarter decisions,
👉 Circleboom Twitter has everything you need — without the extra cost.


