
No single figure answers this, because every account earns a different number, and X shows a repost count under each post without averaging them. What you can get is the average retweets per tweet for each competitor you name, calculated from their recent posts on the same basis as your own.
Reposts per post differ for every competitor on X, so the useful answer is a per-account average and not a platform figure. Circleboom works out reposts per post for each account in a set of up to 5 on X, in one dated report built on official X Enterprise APIs. The same report charts each account's repost totals month by month.
→ average retweets per tweet
Three routes lead to that number, and they do not keep the same things constant.
Three ways to get a competitor's repost figure on X
The benchmark report, a tweet export and a single-account calculator all produce a repost figure for a rival. The table sorts them by what each one keeps constant and where it stops.
| Route | What it keeps constant | Where it stops |
|---|---|---|
| X Competitor Analysis & Benchmark Report | The same fields for up to 5 accounts, pulled on one date, with the per-post average already calculated | Public accounts only, none above 3,000,000 followers, up to about 3,200 recent posts each |
| Export Tweets plus your own spreadsheet | One account's posts in a CSV, with a retweet count on every row | One account per export, and you apply the same filters to each account yourself |
| Twitter X Metrics Calculator | One public account's last 100 posts | No comparison set and a shorter window |
A repost average is only comparable when every account in the set was measured the same way.
The first row is the only route built for comparison. With Circleboom you can put your own X account next to up to 4 competitors. You then read the average reposts for every account in the set from one table. Nothing has to be lined up by hand.
The second and third rows are legitimate routes with narrower jobs. Each one gets its own section further down, after the steps for the report.
Reposts received and reposts made are two separate numbers
The repost average counts the reposts an account's posts receive. It says nothing about how often that account reposts other people.
The benchmark report keeps the two apart, in two different sections:
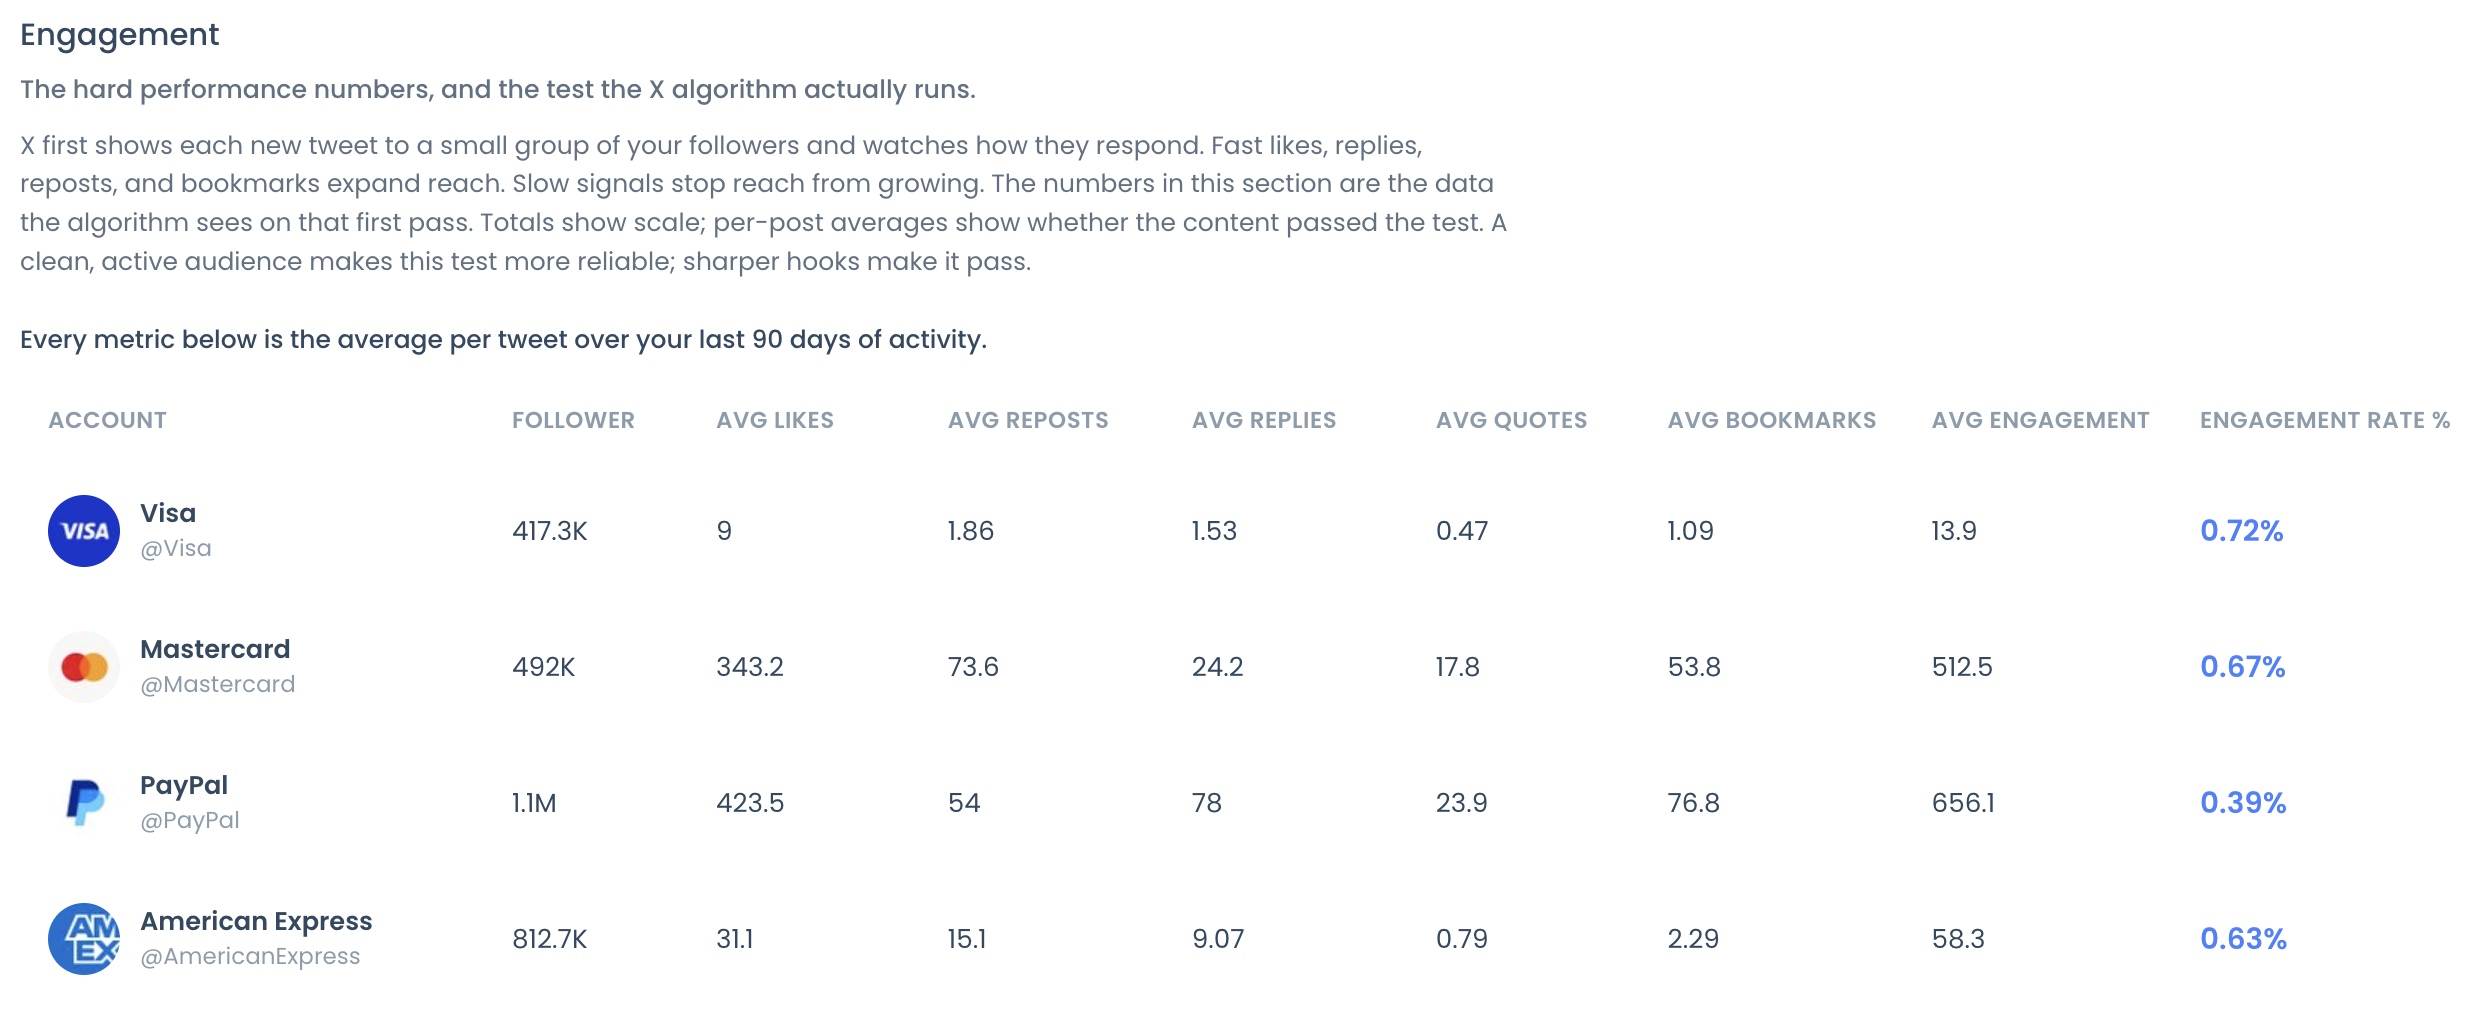
- Reposts received sit in the Engagement summary table, in the AVG REPOSTS column.
- Reposts made sit in Content Type & Format, in the Original / Reply / RT / Quote distribution, which is a percentage breakdown of the account's own activity.
An account can score high on one and low on the other. A brand that reposts partners all day may still earn few reposts on its own posts, so check which number you are quoting.
Quotes are a third thing. X's own guide to the different types of posts treats a repost and a quote as separate types. The report follows that split with an AVG QUOTES column of its own.
A quote adds the sharer's comment, and that comment can support or challenge the original. It is one reason people check who private quote retweeted them before counting a quote as a win.
Why the benchmark report keeps a Twitter comparison fair
The benchmark report keeps the comparison fair by pulling the same fields for every account on one date. For each account in the set, Circleboom retrieves followers, following and up to about 3,200 recent posts from X, then renders identical sections side by side.
A competitor's repost counts are readable at all because of how X classifies them. X's API documentation on metrics lists reposts among the public metrics of a post, while some other metrics are available only to the account that owns the post.
That is why the report can compare reposts across accounts. It is also why owner-only numbers such as profile visits are left out of every column, your own included.
The source matters when you repeat a number to someone else. Circleboom works as an official X Enterprise developer, so every figure in the report is calculated from official records and nothing is scraped. When a client or a manager asks where the average came from, you have an answer.
Two places in the report carry repost data. The Engagement summary table has the AVG REPOSTS column, a per-post average with one row per account. The over-time chart has a Reposts tab that plots monthly totals for the same accounts.
Which accounts make a fair comparison set on X
A fair set is made of direct peers: accounts that share your market, language, scale and publishing purpose. Category leaders are useful to study, but their figures are references and not targets.
Check what each account does on the platform before you trust its average. An account that publishes almost only replies is working as a support desk, and its repost numbers describe customer service, not content. The Original / Reply / RT / Quote distribution shows this in one bar per account.
Keep the set stable from one run to the next. If you swap an account, say so, because a different group is not a change in your position.
Limits to know before you pick the accounts
The report has four limits that decide which accounts can go into a set:
- Only public accounts can be read.
- No account above 3,000,000 followers can be added, and that includes your own.
- A report holds up to 5 accounts in total.
- Each account contributes up to about 3,200 recent posts, which is not its full history.
A report with 4 competitors costs 4 Competitor Tokens, and your own account adds nothing to that bill.
This is the route to use when you need each rival's retweets per tweet in a form you can defend.
Six steps to a competitor's average retweets per tweet on X
To check a competitor's average retweets per tweet, add the account to a comparison set, run one report and read the per-post repost column in its Engagement section. The same run covers up to 5 accounts, so every rival is measured on one date. The six steps below start at the login and end at the monthly repost chart.
Log in and open the benchmark report
- Open Circleboom Twitter Management and sign in with the X account you manage, which can take the first slot of the comparison.

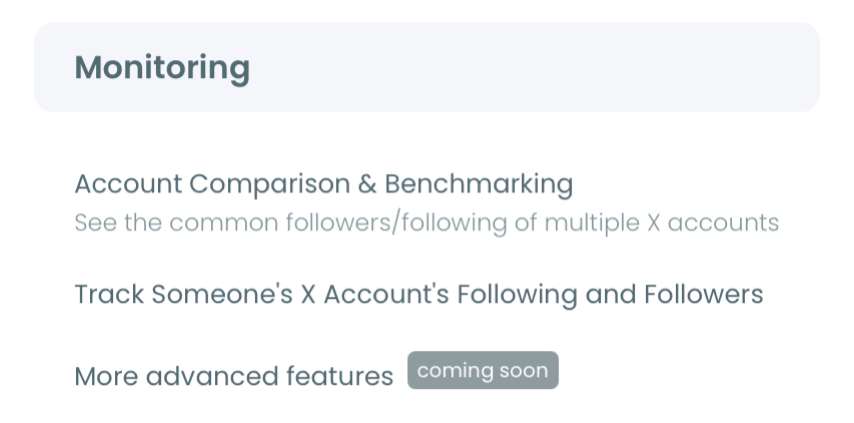
- Go to the Monitoring menu and select X Competitor Benchmark Report, the first item in it.
Build the comparison set and start the run
- Add the accounts you want compared. The Account Handles panel takes your own account plus up to 4 competitors, or up to 5 other accounts, and the + button opens each extra slot.
- Start the run and set how often it repeats. Press Start Competitor Analysis. The report can be a single run with Just this once, or it can repeat with Keep it up to date every month, which produces a new dated report each month.
Read the repost column, then the monthly chart
- Open the Engagement section of the finished report and find the AVG REPOSTS column in the summary table. Each row is one account, and each value is that account's reposts per post.
- Switch the over-time chart to the Reposts tab to see each account's repost totals month by month, and set them beside the averages from step 5.
Reading the average before the chart keeps volume from passing as shareability. The table shows what a typical post earns, and the chart then shows how much of a monthly lead is simply more posts.
Can you export a competitor's tweets and average the retweet column yourself?
Yes. Circleboom's Export Tweets downloads up to 3,200 tweets from any public X account as a CSV, and every row carries a retweet count in a column named CountRetweet.
The export itself is covered in how to export all of a Twitter (X) user's tweets to Excel or CSV.
The do-it-yourself route takes four moves:
- Run export tweets for the competitor's handle.
- Filter the TweetType column so that only the account's own tweets remain, without its retweets and replies.
- Average the CountRetweet column for the rows that are left.
- Repeat with the same filters and the same date range for every other account.
As an illustration of the arithmetic, 400 own tweets whose CountRetweet values add up to 6,000 give an average of 15 reposts per tweet.
Step 4 is where this route stops. Each export covers one account, so the consistency that the benchmark report gives you by design becomes your job in the spreadsheet.
When the spreadsheet route is the better choice
The spreadsheet route wins when you need a cut the report does not draw. The CSV includes the creation date and a media flag for every post, so you can average reposts for one campaign period, or for posts with media only.
Some people look for ways to scrape all of a person's tweets to build this dataset. An export through official API access gives you the same rows without depending on a scraper that can miss posts.
When one Twitter account is all you need to check
For a quick read on one account, the Twitter X Metrics Calculator is the lighter route and a full comparison is more than you need. It is a free Circleboom tool: you enter a public X username, click Calculate, and it works from that account's last 100 posts.
The Twitter X Metrics Calculator shows per-tweet averages in the header above its results, and retweets per tweet is one of them. Below that it returns reach and engagement figures for the same 100 posts.
The trade-off is the window and the missing peers. A hundred posts describe the account's current state, while the benchmark report reads up to about 3,200 posts per account and puts rivals on one date.
The calculator is also a sensible first look before you spend tokens. If the header already shows a rival far above or below what you assumed, you know the full comparison is worth running.
Pick by the question. If you want to know roughly how one account is doing right now, use the calculator. If you want to say that one account's average retweets per tweet is higher than another's, use the report.
What a competitor's repost average on X does and does not tell you
A repost average tells you how often a typical post from that account is shared. It does not tell you why people shared it, or whether they agreed with it.
Four reading rules keep the number honest:
- Inspect what was shared before you call a repost an endorsement.
- Check the top posts in Content Leaderboards, because a single outlier post can lift an average.
- Compare post dates, since the same number of retrieved posts covers a shorter period for a frequent publisher.
- Treat a changed average between two runs with care, because the sample rolls forward as new posts enter and older ones leave.
The mistake I see most often is quoting a rival's monthly repost total as if it were the average. The total rises with every extra post. The average retweets per tweet only moves when the typical post changes.
What to do when a rival's average is higher than yours
Once the gap is real and per post, the report's guidance points at the content itself. Its growth tip for this column says reposts come from content people want to pass on, and it gives lists, data and useful resources as examples. Compare the formats behind each account's most-shared posts with your own.
Your own best-shared posts deserve a second look too. When one is still timely, auto retweeting can bring it back on a schedule.
How two dated runs show whether a repost average moved
Each run of the report is dated, and running the same set again creates a new report without replacing the old one. Earlier runs stay under Past Analyses for that set, so you can open two dates and compare the same column.
Read the per-post average first and the monthly totals second. A change that appears only in the totals usually follows the number of posts. A change in the average retweets per tweet that holds across two runs is the one worth reporting.
On a monthly schedule the next report arrives by itself, and End Scheduling stops it whenever you choose.
An average also leaves one thing open: who did the reposting. That is a separate export, and the FAQ below covers it.
Retweeter export on screen: how the accounts behind a post's reposts are pulled into one list, the part an average cannot show.
Summary: reposts per competitor post on X come from one column
Competitor posts on X do not share one repost figure. Each account has its own per-post average, and that average is only comparable when every account is measured from the same fields on the same date.
The benchmark report gives you that column for up to 5 accounts, the export route gives you custom cuts, and the calculator gives you a fast single-account read. Start with the route that matches your question, and quote the average retweets per tweet only next to the date and the accounts it was measured on.
→ Compare retweets per tweet across your competitors
Frequently asked about repost averages on X
Can I see which accounts are reposting a competitor's posts?
Yes. Circleboom's Export Accounts Who Retweeted a Tweet(s) or User(s) exports the accounts that retweeted a tweet from any public X account as a CSV. Queue several of a rival's tweets and each account appears once, with a RepostCount value showing how many of the queued tweets it retweeted.
How do I find out who reposts my own posts the most?
Circleboom's Engaging & Loyal Followers analyzes your last 3,200 tweets on X, retrieves the retweeters of each one and ranks your followers by Times Retweeted. Those repeat sharers are the people often called power followers, and they are the accounts worth thanking first.
What is a good number of retweets per post?
There is no universal good number, and X does not publish one. I treat a figure as good when it sits at or above the per-post average of direct peers, meaning accounts that share my market, language and scale, measured in the same report.