
A rival's clips keep showing up in your feed, yet you cannot tell whether they publish video every day or once a fortnight. The feed shows you the videos that traveled, not the ones they posted, so frequency stays invisible until someone measures it.
How often do competitors post videos on X?
It differs by account, and the dependable answer is a measured share: the percentage of each rival's recent tweets that carry video, read with their total video views. Circleboom calculates that video posting rate and the views behind it for up to five X accounts side by side, through X's Enterprise API access.
→ Track competitor video posts on X in one dated report
Why your X feed misleads you about competitor video frequency
Your feed is a filtered sample. It favors posts that already earned attention, so a competitor's two strong videos can feel like a daily habit while their thirty plain text posts never reach you.
The result is a guess about frequency built from the wrong evidence.
Counting by hand does not fix it. Scrolling a rival's media tab for a week gives you a number gathered on a different day, over a different period and with a different method than the count you take for the next account.
Put three of those side by side and nobody can defend the comparison.
The fix is to track competitor video posts on X from one source that measures every account the same way, on the same date.
That is a reporting problem, not a scrolling problem.
A rate without context also misleads. A rival can post a high share of video and still collect few views per video, or post rarely and get large views each time. You need both the rate and the viewing result before the number means anything for your plan.
You can measure competitor video posts on X from one report instead of building a spreadsheet by hand. A hand-built sheet rarely survives the first question about how it was made.
What the X competitor report shows about video
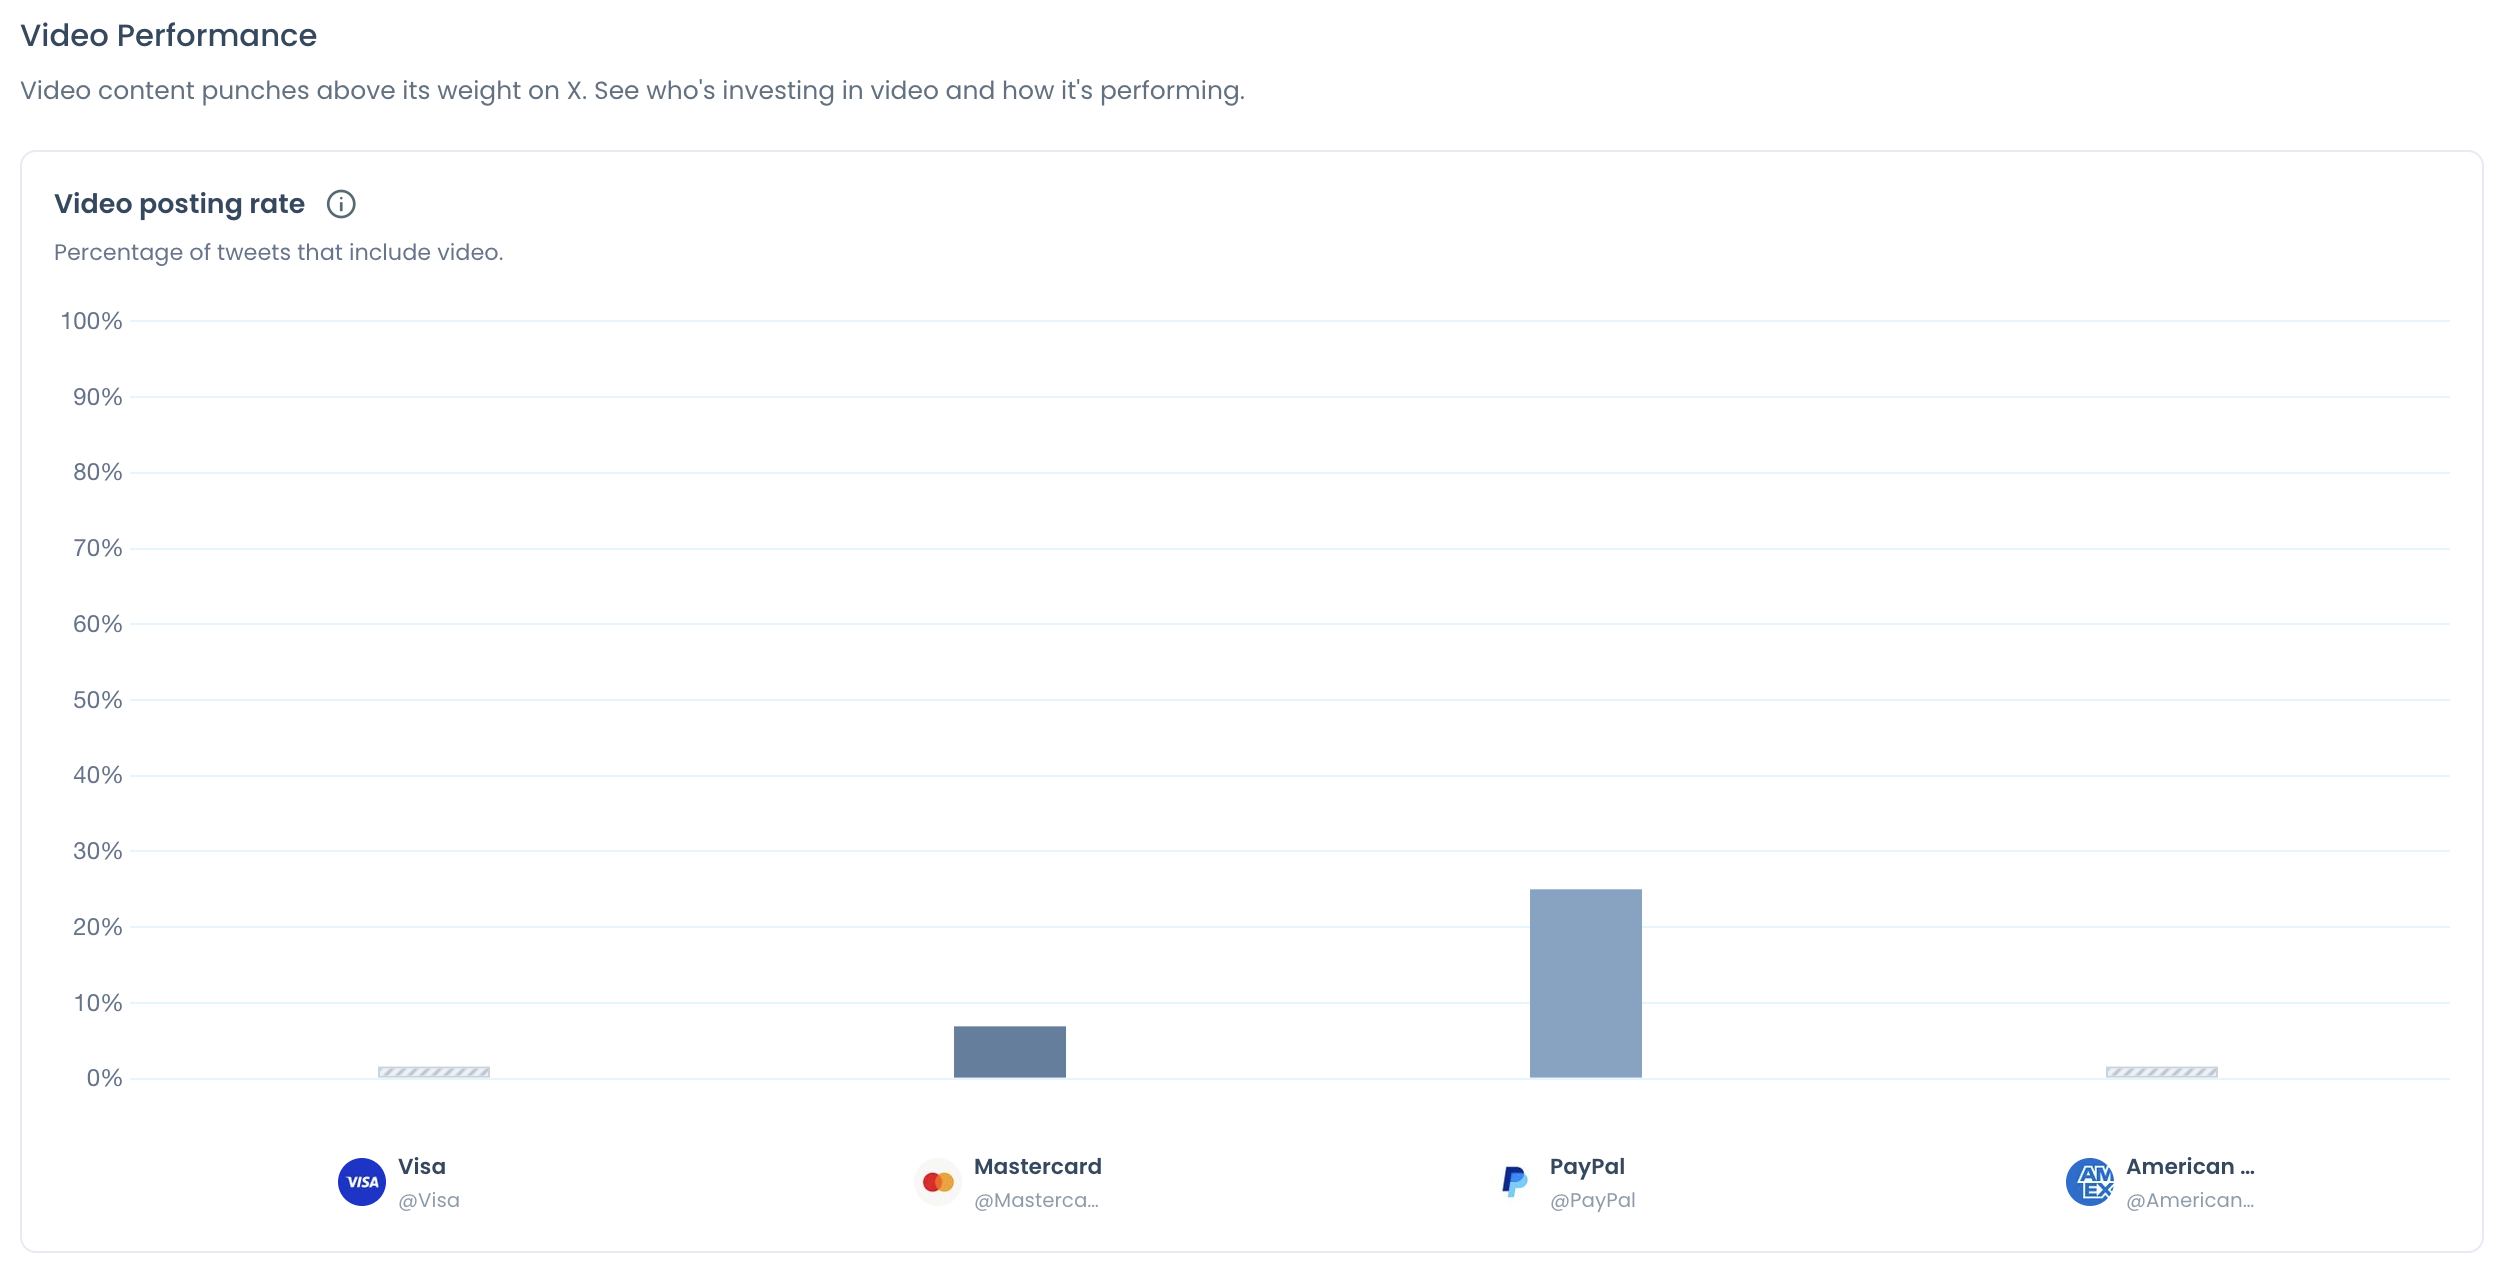
The Video Performance section of Circleboom's X Competitor Analysis & Benchmark Report answers the frequency question with two panels, rendered side by side for up to five accounts:
- Video posting rate: the percentage of each account's tweets that include video.
- Total video views: each account's total video views, plus a per-video breakdown over time.
Circleboom retrieves followers, following and up to about 3,200 recent tweets for every account in the set, then calculates the same nine sections for each one. Video Performance is the last of them, after the essentials table, audience quality, demographics and geography, posting behavior, content type and format, engagement, Impression/Views and the content leaderboards.
The records come straight from X, and Circleboom pulls them as a developer named on the Enterprise customers page X maintains. For a video comparison that matters, because a dataset with missing tweets would print a lower video rate than the account really has.
Circleboom gives you competitor video posts on X as measured figures, not impressions from a timeline. When you are ready, compare competitor video posts on X across five accounts and read both panels before drawing a conclusion.
How to turn a video posting rate into videos per week
A video posting rate is a share, not a frequency. To answer "how often," multiply the rate by the account's recent cadence: video rate × posts per day × 7 gives a rough planning figure for videos per week, not a measured count.
The Posting Behavior section of the same report prints two bars per account, Lifetime Average and Last 30 Days Average posts per day. Use the last-30-days bar, which describes the account as it runs now.
The rough arithmetic for two hypothetical rivals:
| Account | Video rate | Posts per day | Videos per week |
|---|---|---|---|
| Rival A | 25% | 2 | 3.5 |
| Rival B | 8% | 6 | 3.4 |
A 25% rate and an 8% rate can mean roughly the same weekly video output. Rival A looks video-first and Rival B text-first, yet both work out to about three or four videos a week.
That changes the brief: if your goal is matching a rival's video volume, the weekly figure is the target. If your goal is matching their content mix, the rate is the target.
Two cautions keep the figure honest. It mixes two windows: the video rate covers the analyzed sample of up to about 3,200 recent tweets, while the Last 30 Days Average bar covers only the past 30 days. Treat the result as a rough planning figure, never as a count of videos posted.
And if the two cadence bars differ sharply, the account changed its output recently, so check the per-video breakdown dates first.
How to track competitor video posts on X with Circleboom
To track competitor video posts on X, put your rivals in one benchmark report, read the Video Performance panels, and convert totals into views per video. Circleboom runs the pull and the layout from the Monitoring menu in five steps, grouped into setup and reading.
Set up the comparison in the Monitoring menu
- Log in to Circleboom Twitter and decide whether your own X account takes the first slot.

- Open the Monitoring menu and select X Competitor Analysis & Benchmark Report, the first item in the list.
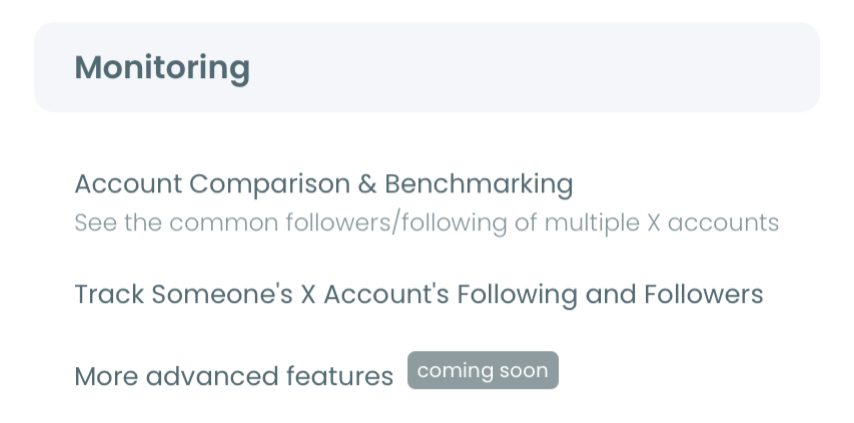
- Add the rival handles under Account Handles, using the + button for more slots up to five accounts, then select Start Competitor Analysis and choose Just this once or Keep it up to date every month. Competitor Tokens are charged per competitor per report, and your own account never uses one.
Read the video panels and save the baseline
- Scroll to Video Performance and read the video posting rate for each account in the set.
- Divide each account's total video views by its number of videos in the per-video breakdown, and note the run date beside the result.
Setup comes before reading for a reason: every account is pulled on the same date with the same method, so the rates you compare share one basis. Dividing totals into views per video keeps an account that simply posts more videos from looking like it gets more attention.
The sequence in one line: log in, open Monitoring, add up to five handles, start the run, read the two video panels.
Can you see a competitor's video retention on X?
No. Retention curves are an owner-only metric, and the competitor report leaves owner-only metrics out of every column, including your own, so no cell sits blank in one account and full in another. When you track competitor video posts on X, the report gives you rate and views for rivals, never how far viewers watched.
Retention belongs to your side of the comparison. Circleboom's Twitter Video Analytics shows your own natively uploaded videos as a bar chart across five stages: Video Started, 25%, 50%, 75% and 100% Watched.
That split sets a clear rule.
The only fair meeting point between you and a rival is views per video.
If your views per video trail theirs, your own stage chart tells you where viewers leave. A large drop before 25%, for example, points at the opening quarter.
Your own starts need one caution. X says that native videos and GIFs autoplay in timelines and across the app, so a start can come from someone scrolling past. Read starts next to likes, reposts and replies before you call a video watched.
The competitor report works with counts and shares, not viewer lists. So if you are asking whether Twitter shows who viewed your video, this report will not answer it for any account.
Does a high video posting rate mean video works for that rival?
Not by itself. A video posting rate measures how much of an account's output goes into video, which is investment. Views per video and engagement measure the response, which is return. The report keeps those in separate panels so you can see when they disagree.
In a sample report run on public accounts, the account with the heaviest media share, 87.5%, and the only meaningful video rate in the set, 25%, also carried the lowest engagement rate of the group, 0.39%.
Heavy video effort and weak response sat in the same column.
So read the rate as a question, not an answer.
When I see a rival posting video in one tweet of every four, I read it as a statement of belief. Their views per video and engagement tell you whether their audience agrees.
Visual posts do have reasons to exist, and the case for why Twitter visuals are vital for effective Twitter marketing still holds for many accounts. The report simply lets you check that case against a named competitor before you copy their production plan.
If the numbers say video deserves more of your output, the posting side is quick to set up.
Posting your answer to their video rate: scheduling X video posts in Circleboom and repeating the strong ones with Auto Repost.
How far back the X report looks for competitor videos
The report reads up to about 3,200 recent tweets per account, not full history. A rival that posts ten times a day fills that window in under a year, while an occasional poster's 3,200 tweets can stretch back much further, so the same video rate can describe very different periods.
Three practical rules follow:
- No videos in the sample does not mean the account has never posted video.
- Only public accounts can be added, and accounts above 3,000,000 followers cannot be analyzed.
- Each run is a snapshot of its date, so quote the date with any rate you report.
To watch a rival's video habit change over months, keep the same accounts in the set and put it on a monthly schedule. Circleboom's help center explains how to schedule monthly competitor reports. A 12-month schedule gives 13 dated reports, the first plus one a month.
For a quick look at the full output before you spend a token, the X competitor sample report shows every section, Video Performance included.
Which video move fits your X account
The report ends in one of four situations, and each points at a different next step:
- If a rival's views per video beat yours and they post more video, test more video on your account and schedule it in X Post Planner.
- If their views per video beat yours but they post less video, the gap is quality, so review your own stage chart before you post more.
- If your views per video match or beat theirs, your videos already work; reuse the strongest ones through cross-posting videos to Reels and Shorts.
- If nobody in the set posts much video, the category has room, but a low rate alone does not prove demand.
Each branch starts from the same habit: track competitor video posts on X on a dated basis, then let your own Video Analytics explain the gap you find.
→ Start tracking competitor video posts on X this month
Competitor video tracking on X: a three-question FAQ
Do YouTube links show up in Circleboom Video Analytics?
No. Video Analytics reads only videos uploaded natively to X when the tweet was posted, so a tweet that links to YouTube produces no retention data. If you share YouTube content, the guide to posting YouTube videos on Twitter automatically covers that workflow.
How can I get more views on my X videos once I post more of them?
Start with the videos your stage chart shows people finishing, and resurface them with Auto Retweet or cross-post them, since strong completion marks a video worth repeating. The post on how to get more impressions on Twitter videos adds more ideas.
Does adding my own account to the report cost a token?
No. Competitor Tokens are charged per competitor per report, and your own account never consumes one. Five competitors on a 12-month schedule is 13 reports and 65 tokens.