

The best tool to analyze your Twitter followers' behavior is one that reads what your audience actually does, not just where they live or what gender a model guessed. Most "follower analyzer" apps stop at a head count and a pie chart of countries. Behavior is a different question.
What follower-behavior analysis actually shows you.Which followers are active, moderately active, or effectively dormant.What topics your audience clusters around, pulled from their own profiles and posts.The languages your followers read in, so your copy meets them where they are.The hours your specific audience is awake and scrolling, not a generic best-time chart.
Circleboom groups your followers by real behavior on X through sanctioned, policy-compliant access. Start with the tools to analyze Twitter followers behavior in one dashboard.
Why Demographics Alone Mislead You
Demographics describe who your followers are. Behavior describes what they do with their attention, and that gap is where most reporting falls short. A profile can tell you a follower is a 30-something marketer in Berlin and still leave you blind to the fact that they last opened X six months ago. Knowing the label does nothing for your reach if the account is asleep.
This is the trap behind a high follower count that produces low engagement. If 12,000 of your 20,000 followers are inactive or low-signal, your content lands in a much smaller room than the number on your profile suggests. The follower count is identical whether 90% are awake or 40% are. Only the behavioral composition tells you which reality you're in.
To get past the head count, you need a layer that classifies followers by activity, maps their interests, and shows when they're online. That is exactly what a real behavior analysis does. You can preview the full set of tools to analyze Twitter followers behavior before you commit to any cleanup or campaign decision.
The number on your profile is a vanity metric until you know how that audience behaves.
What Circleboom Reads That Other Analyzers Skip
Circleboom analyzes your Twitter followers' behavior on X across four behavioral dimensions and presents the result as a single composition dashboard. Instead of one global score, you get the proportion of your base that is human versus fake, active versus inactive, ordinary versus overactive, and verified versus unverified. The split is the insight, because a 20,000-follower account behaves completely differently when 78% are active than when only 40% are.
Circleboom is an official X Enterprise Developer, so every follower profile it reads comes through sanctioned, policy-compliant access. Your account never touches a scraper or an unofficial workaround, which means no suspension risk while you study your audience. That matters most when you're analyzing thousands of accounts at once.
The slices behind the composition dashboard
Behavior analysis is more than a one-screen breakdown, though. The same audience data feeds adjacent reads: an interest cloud that shows what your followers care about, a language split, and a time-zone map of when they're awake. A general Twitter Follower Analysis pulls these slices together so the composition view becomes a content plan, not just a diagnosis.
The language split is the slice most creators overlook. If a third of your followers read primarily in a language you never publish in, half your audience is quietly tuning out every post, and no amount of better hooks fixes a language mismatch. Seeing that proportion is often the difference between rewriting your copy and translating it.
For comparison, doing this by hand means opening hundreds of profiles, eyeballing last-tweet dates, and guessing at activity. Circleboom classifies the entire base in one pass and shows you the proportions at a glance.
The behavioral lens is what separates analysis from a head count. Counting tells you the size of the room. Behavior tells you how many people are actually listening.
How to Analyze Twitter Followers' Behavior with Circleboom
To analyze your followers' behavior, connect your X account, open the analytics view, read the composition split, then move from the overview into the specific slices that drive content and timing. The workflow below runs that loop through official API access in two phases.
Connect your account and open the analytics view
- Log in to Circleboom Twitter and connect your X account with official OAuth.

- Open the Follower & Following management and analytics menu from the dashboard.
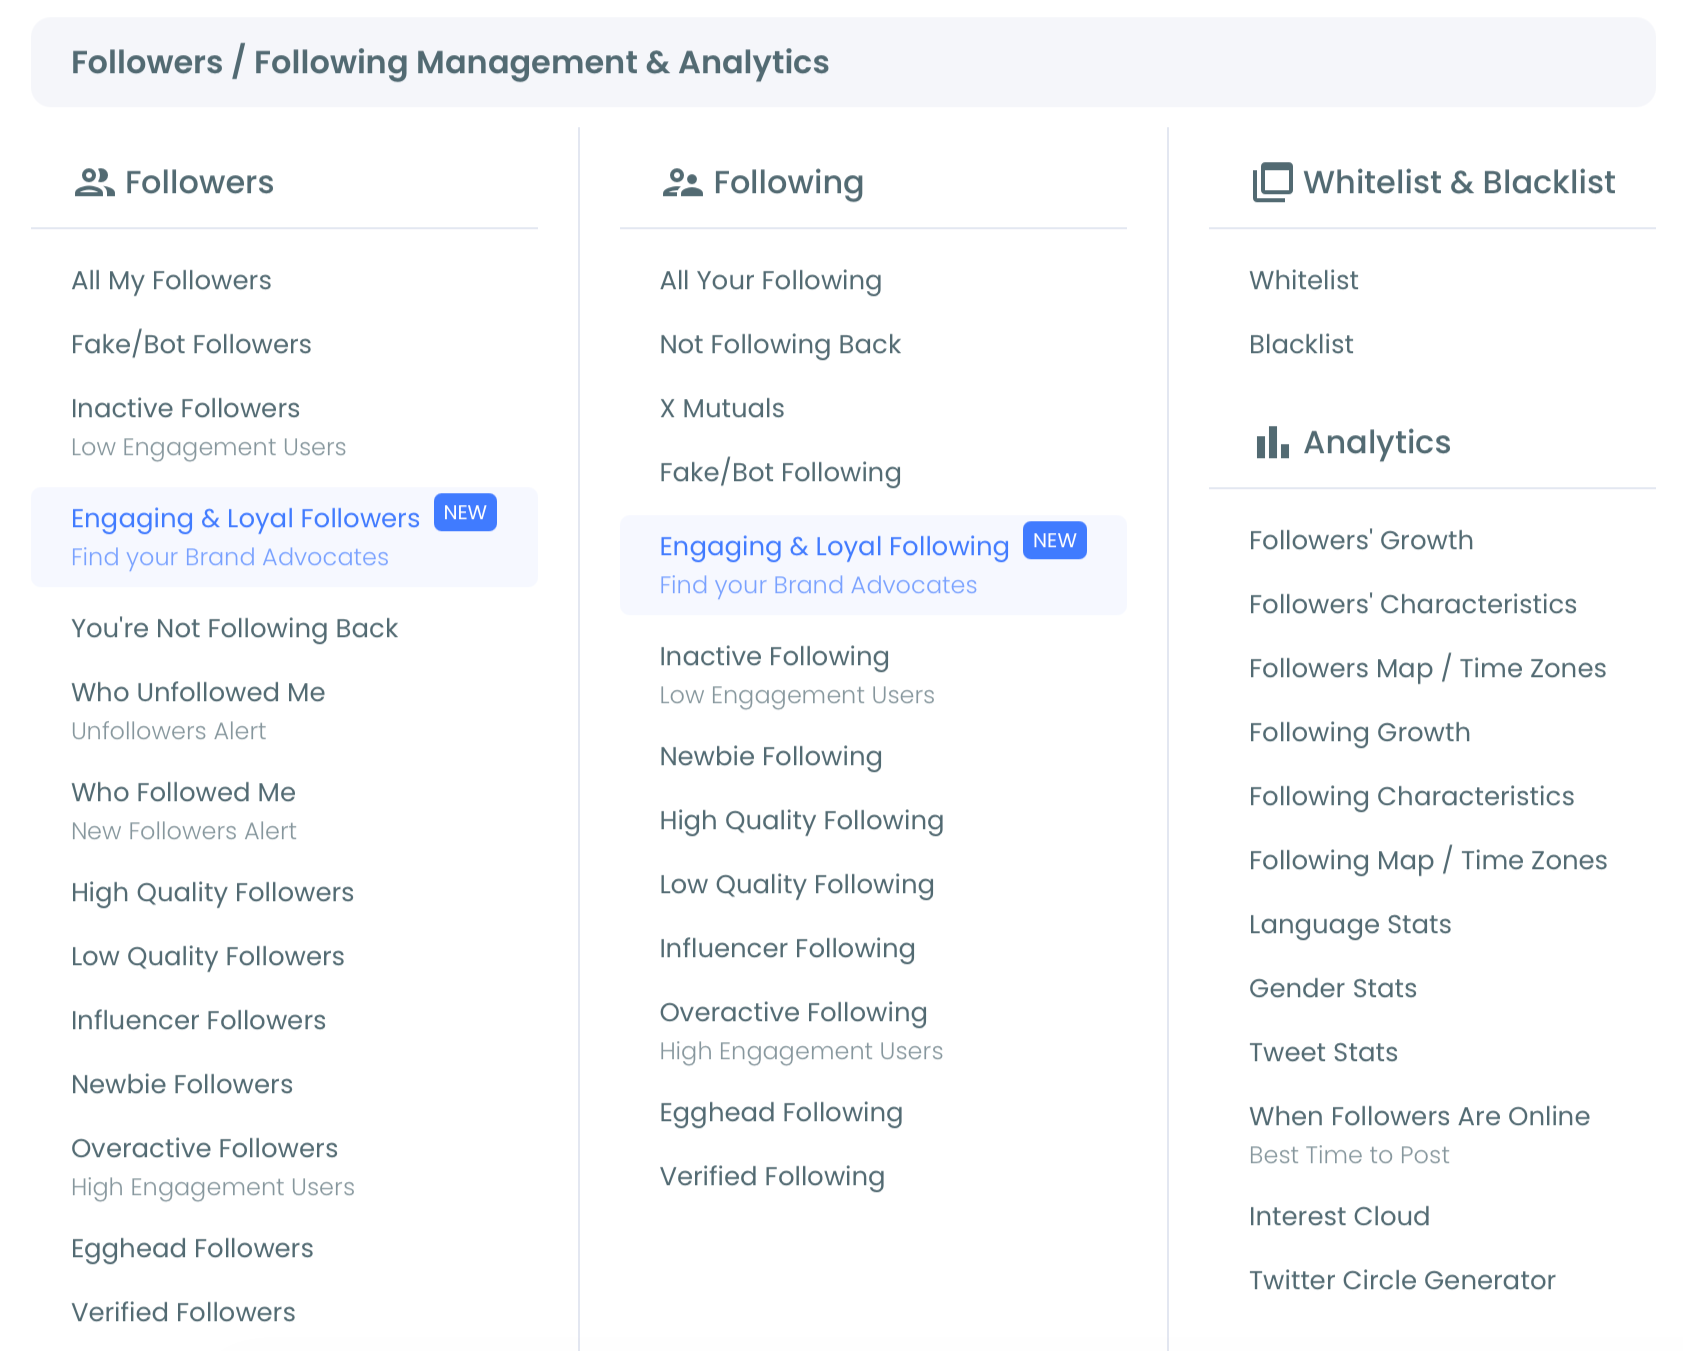
- Select the Followers' Characteristics view to load the "Followers in a nutshell" dashboard, which classifies your base across human/fake, active/inactive, ordinary/overactive, and verified/unverified.
Read the behavior, then act on the slices
- Read the activity bands first to see what share of your audience is active, moderately active, or effectively dormant, since dormant followers cannot engage no matter how good your content is.
- Open the interest cloud and language split to learn what topics your followers cluster around and which languages they read in, then shape your topics and copy to match.
- Check the time-zone and when-online map to find the hours your specific audience is awake, and schedule your posts into those windows instead of relying on a generic chart.
- Export the dashboard as a PNG or PDF from the menu in the top-right corner when you need an audience-quality snapshot for a media kit or sponsorship pitch.
That order holds up because each layer narrows the last: activity tells you who can engage, interests and language tell you what to say, and the online map tells you when to say it. Skip the activity read and you optimize timing for an audience that was never going to show up.
See it live: how the four behavioral splits and the interest cloud render side-by-side in one Circleboom audit view.
Turning Behavior Into Content and Timing Decisions
Behavior data is only useful when it changes what you publish and when. The activity bands tell you how big your real audience is, so you can stop blaming content for reach problems that are actually composition problems. If 40% of your base is dormant, the fix is audience health, not another rewrite.
The math makes this concrete. If you have 20,000 followers and the active band sits at 55%, your effective audience is roughly 11,000 accounts, not 20,000. Every engagement-rate calculation you run against the full count understates how well your content performs with the people who can actually see it. Reading the band first reframes what "good engagement" even means for your account.
The interest cloud is where behavior becomes editorial direction. When your followers cluster around two or three themes you weren't prioritizing, that is a signal to shift your topic mix toward what they already follow. You can sharpen this further with Twitter Interest Targeting, which turns those interest clusters into a targeting plan for outreach and campaigns.
Reading When Your Followers Are Actually Online
Timing is the slice most accounts get wrong. Generic best-time lists are population averages, and the genuinely best time to post is whenever your own followers are most active, which varies sharply by account.
The principle holds across every credible posting-time study: geographic spread and work-versus-leisure patterns decide your window, not a one-size chart. Circleboom's when-online map gives you that window for your specific base.
For a deeper walkthrough of reading these slices, the guide on the best way to analyze your Twitter followers lays out the full sequence. The breakdown of the best followers analyzer for Twitter compares what each view shows.
Summary
The best tool to analyze Twitter followers behavior is the one that reads activity, interests, language, and timing, then turns those reads into content and scheduling decisions. Demographics tell you who follows you; behavior tells you who is actually listening and when. Circleboom maps all four behavioral layers on X through sanctioned, compliant access, so you study your audience safely and act on real signal instead of a vanity number.
Start by checking the Twitter follower behavior analysis for your own account and let the composition split set your next move.
Still mapping the mechanics? The primer on how to analyze Twitter followers and the deeper read on Twitter follower segmentation both extend what the behavior dashboard starts.
→ Analyze your Twitter followers' behavior
What People Ask About Follower Behavior
What is the difference between follower demographics and follower behavior?
Demographics describe who your followers are, like location, language, or inferred gender, while behavior describes what they do, like how active they are and when they post. Behavior is the better predictor of engagement because a perfectly matched demographic profile means nothing if the account is dormant.
Can I see which of my followers are inactive?
Yes. Circleboom's Followers' Characteristics dashboard shows the active-versus-inactive split for your whole base, and the dedicated Inactive Followers view lists the specific accounts so you can review them before any cleanup.
Is it safe to analyze thousands of followers at once?
It is safe because Circleboom is a verified Enterprise partner of X and reads your follower data through sanctioned access, not scraping or unofficial workarounds. Your account stays compliant with X's rules, so there is no suspension risk even when you analyze a large base in one pass.
How do I find the best time to post for my own followers?
Use the when-online map in your follower analysis rather than a generic best-time list. It reads the time zones and activity windows of your specific audience, which is the only timing data that reliably matches your account.


