
A tweet that lands with almost no views feels like a punishment, so suppression is the first explanation most people reach for.
The duller explanation is far more common. The post went out into an hour when hardly any of your followers were on the platform, and nothing that happened afterwards could rescue it.
Those two answers call for opposite responses. That is why the order you test causes in matters more than the list of causes itself.
Why aren't my tweets getting seen on X?
Usually one of four things: your account or post state, an empty posting window, an audience that was never going to see you, or genuine reach limiting by the platform. Circleboom charts your own followers' active hours on Twitter, which settles the second cause with data rather than a hunch.
→ when your followers are online
The four causes, ordered by what it costs to test
Most reach checklists rank causes by how likely the writer thinks they are.
Ranking them by how expensive they are to test is more useful, because three of the four cost you nothing and one of them can eat a week.
Cause one is account and post state. A protected account, a post that leads with an outbound link, a reply buried under a large thread.
All of these are visible to you in seconds and none of them require a tool.
Cause two is the posting window. This is the one that hides, because the evidence for it does not live on your post at all. It lives in your follower list.
Cause three is audience composition. A follower count is not a reachable audience, and the gap between the two is invisible from the compose box.
Cause four is platform-side reach limiting.
It is last not because it is impossible, but because it is the only cause you cannot directly observe, and every hour spent on it is an hour not spent on the three you can.
Circleboom reads the activity pattern of your own followers on Twitter and plots it across every day and hour, which is what turns cause two from a suspicion into a reading.
If you are asking why aren't my tweets getting seen, that reading is the cheapest real answer available to you.
Before any of that, it helps to know how many followers actually see your tweets under normal conditions, because the baseline is lower than most people assume.
Is a shadowban really why your tweets aren't getting seen?
Sometimes, but it is the most expensive hypothesis on the list and people start with it anyway.
X documents the instances where it limits reach and describes restricted content as being made less discoverable, in some cases with a label attached to the post itself.
That distinction matters for diagnosis. Part of this category is designed to be visible to you, and part of it is not.
The part that is not visible is the part no third-party product can read. There is no endpoint that returns "this account is being filtered," which is why every honest visibility check is a behavioural test rather than a lookup.
A tool that claims to detect suppression is inferring it from public behaviour, not reading it from a switch.
That is still worth doing, and Circleboom's Twitter Shadowban Test runs exactly that kind of behavioural check on search and reply visibility. Treat the result as evidence rather than a verdict.
The reason to run the cheap causes first is that a suppression result changes almost nothing about your next action, while a posting-window result changes your calendar tomorrow.
The fuller version of that argument sits in whether your tweets are being hidden from others. It walks through the observable signals in more depth.
How to find out why your tweets aren't getting seen on X
A sudden impression drop taken apart on video, shadowban question included.
https://www.youtube.com/watch?v=g4VD-Lc2sYM
The process, in order.
Set the account state before you read any chart
- Log in to Circleboom Twitter and connect the X account you are actually worried about, not a spare.

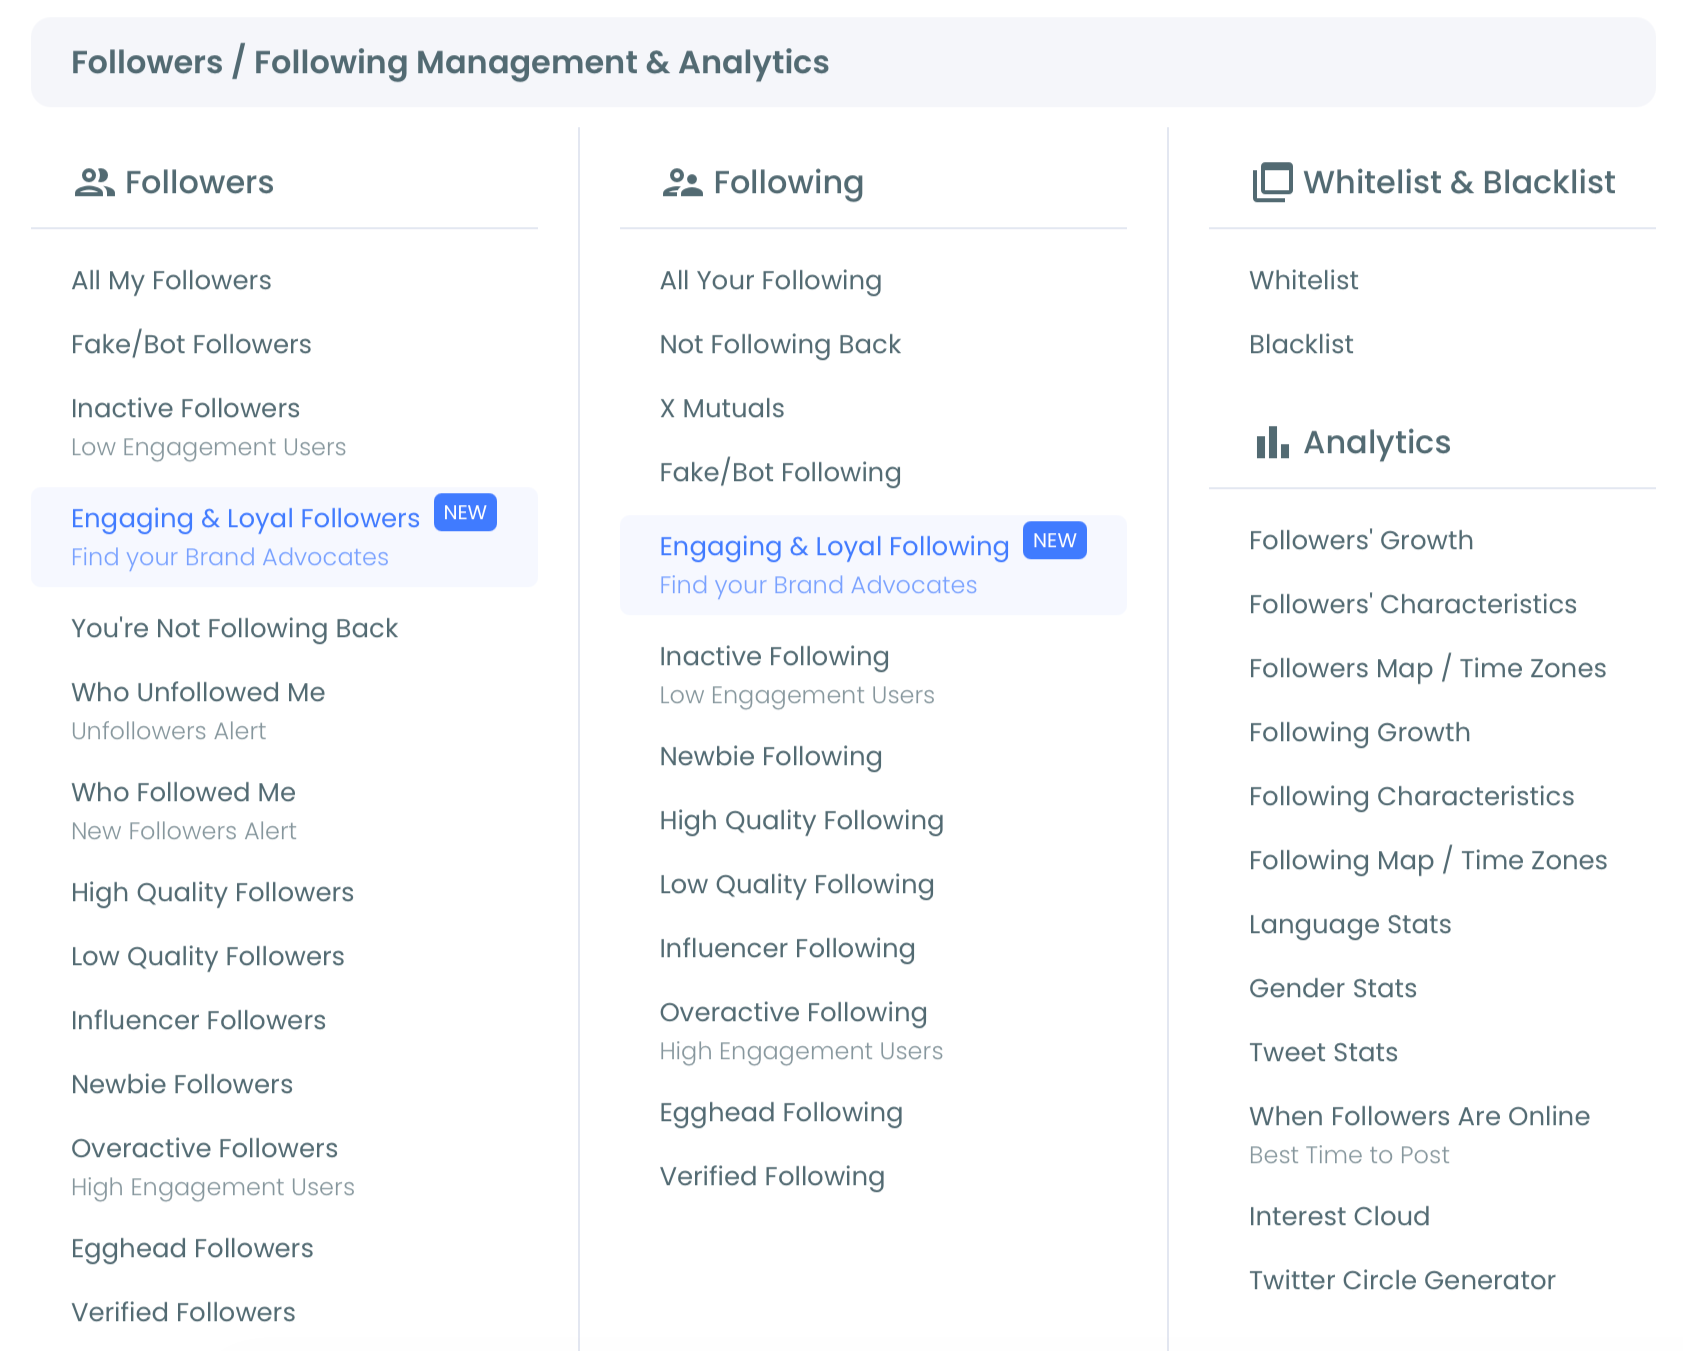
- Go to the Follower and Following analytics menu, the section that holds reports built from your audience rather than from your posts.
- Check the time zone set on your Circleboom account before you read anything, because the chart draws its hours against that setting rather than against your followers' local clocks.
Read the activity chart before you change anything
- Open our When Followers Are Online report and let the "When Followers Are Online: Best Times To Post" bubble chart finish drawing. Days of the week run down one axis, hours run across the other, and bubble size shows how concentrated follower activity is in that slot.
- Widen the date range using the scrollable control below the chart, so one quiet week cannot decide the diagnosis.
- Compare the slots your recent posts went out in against the largest bubbles. If your habitual hours sit in the sparse part of the grid, you have found a cause you can act on today.
Turn the reading into something you can test against
- Click the "Pick All Best Times: Add to My Posting Queue Now!" button to push the identified peak slots into your Circleboom posting queue, then open the queue and clear anything that now double-books.
- Export the chart as a PNG, JPG or PDF from the three-dot menu, so the state you started from is on record when you read the grid again.
That order is deliberate rather than cosmetic. The login and the time-zone check come first because a grid read against the wrong clock produces a confident wrong answer.
Reading before scheduling stops you confirming the calendar you already had, and queueing and exporting sit last because both are consequences of the reading rather than inputs to it.
Compressed, the run is: connect, fix the clock, widen the range, compare your habits against the dense slots, queue, export.
What the follower activity chart cannot tell you about reach
It cannot tell you how many people saw a given post.
The chart is built from follower activity patterns, not from post impressions, so it answers "was anyone around" and never "how far did this travel."
It cannot tell you whether X limited a post. No audience-side report can, and a product that says otherwise is selling you an inference dressed as a measurement.
It cannot tell you whether the writing was any good. A perfectly timed weak post is still a weak post.
What it does is remove one variable from a four-variable problem, permanently.
Once your schedule sits inside the dense part of the grid, a post that still lands flat is telling you something about content, audience or platform state rather than about the clock.
That is a smaller question than the one you started with.
For the other half of the picture, X impression analytics reports what your posts actually earned, which is the measurement the activity chart deliberately does not attempt.
Circleboom is an X Enterprise partner verified by X itself, which matters here for an unglamorous reason.
The activity behind those bubbles is read across your full follower base rather than whatever slice an unofficial tool could reach, so when the chart says timing is not your problem, you can actually rule the cause out instead of half-ruling it out.
Ruling a cause out cleanly is worth as much as confirming one. Read your audience's active hours on X and you either find the fix or you retire a suspect.
What changes when timing stops being a variable on Twitter
The first change is that failure becomes readable.
When posting time was random, a weak result could be blamed on the hour, the topic, the writing or the algorithm, and none of those guesses could be separated from the others.
The second change is that comparisons start working. Two posts published into similar activity density are comparable; two posts published twelve hours apart are not, however similar their content.
The third change is emotional, and it is not a small one. A visible reason to stop suspecting a penalty is worth having, because suspicion tends to produce worse posting rather than better.
Accounts in the small-to-mid range feel this hardest. It is why the question of reduced organic reach for small to mid accounts keeps coming back around every few months.
There is a practical side effect too. A fixed set of windows makes your posting cheaper to run, because you stop re-deciding the same question every morning and start spending that attention on the post instead.
Timing is only ever half of the reach question, though.
The other half is whether the people who are around are the right ones.
That is what whether your tweets are reaching the right audience is built to answer. It is the natural next check once the clock has been settled.
Where to go next based on what you found
Match your result to the branch below rather than working through all four causes again.
If your posting hours sat outside the dense slots, you found it. Move the schedule, hold the new windows for a few weeks, and change nothing else while you watch.
If your posting hours already sat inside the dense slots and results are still thin, timing is retired as a suspect. Move to audience composition next, because a large follower count with a small reachable core produces exactly this symptom.
If the whole grid is faint rather than uneven, the problem is more likely the size or the state of your follower base than any particular hour.
If you have worked through all three and the pattern still makes no sense, that is the point at which a suppression check earns its place, not before.
Whatever the branch, write down what you changed and the date you changed it.
A diagnosis you cannot reconstruct in a month is a diagnosis you will end up running twice, and the second run tends to reach a different conclusion for no reason other than a different sample of weeks.
Whichever branch you land on, the reading comes first: → your follower activity chart
Reach questions worth answering before you blame the algorithm
Does the chart show me how many people saw a specific tweet?
No. It shows when your followers are active across the week, not what any individual post earned.
For per-post numbers you need post analytics, which is a different report answering a different question. Keep the two separate in your head, because conflating them is how people end up with the wrong diagnosis.
How long should I wait before deciding a schedule change worked?
Long enough that a single strong or weak post cannot swing the result, which in practice usually means a few weeks of normal posting.
Judging a timing change on two posts is how most people conclude that timing does not matter.
My follower count is fine but the whole grid looks faint, so what does that mean?
It usually means a large part of your follower list is not active on X in any hour, which is an audience problem wearing a timing problem's clothes.
That is worth investigating on its own, because no schedule can reach people who are not there.
Do the hours on the chart reflect my followers' local time?
No, they are drawn against the time zone configured on your Circleboom account.
If your audience sits mostly in another region, translate the peaks before you diarise them, or you will schedule confidently into the wrong window.
Will the one-click best-times button overwrite what I already have scheduled?
No. It adds the identified peak slots to your Circleboom posting queue rather than writing over your calendar.
Open the queue straight afterwards and check the new slots against anything already planned, because the button cannot see your intentions.