
What does a competitor's follower count on X leave out? It leaves out how many of those accounts are suspected bots, how many have stopped posting and how the whole list sorts by quality.
Competitor audience quality is the makeup of a rival's follower list: how much of it is human, active and in a high quality tier, read beside the follower count. Circleboom compares up to 5 public accounts on X and classifies every follower list the same way through X's official Enterprise APIs.
→ competitor audience quality
Each classification below is defined with the thing it does not prove.
What is competitor audience quality on X?
Competitor audience quality is a description of who is inside a follower count, not how large the count is. It answers a different question from the number on the profile page.
A follower count answers "how many accounts ever followed and have not left?" Audience quality answers "how many of them could respond to a post today?"
The two drift apart with age. A follower total only accumulates. Accounts that went dormant, were abandoned or were never run by a person stay in it, so the gap between the headline and the responsive audience grows as an account gets older and larger.
Four classifications describe that gap:
- Human vs fake/bot.
- Active vs inactive.
- Ordinary vs overactive.
- Quality tiers: High, Medium and Low.
Circleboom calculates all four for each account in a comparison on X, from follower records retrieved through official APIs, and shows them side by side. You can check a competitor's audience quality next to your own or compare several rivals with each other.
The sections that follow define each classification in one line, then state its limit. The limit is the part most write-ups on competitor audience quality skip.
What each Twitter audience classification means and what it leaves unproven
Every classification is a review signal calculated from profile and activity data. None of them is a ruling on an individual account.
Human vs fake/bot
Human vs fake/bot is the share of followers classified as human or as suspected fake or bot accounts, using Circleboom's account signals. The report gives the share and the number of accounts for every compared account.
What it leaves unproven: identity. A flagged account has signals that deserve a look. It has not been verified as fake by X or by anyone else.
Is a flagged fake or bot share proof or a signal?
A flagged fake or bot share is a signal for review, not proof. The classification is Circleboom's analysis of official X API records, and a suspected label confirms nobody's identity.
That limit changes how the figure should be used. Quote it as "suspected," open the drill-down list behind it, and look at the accounts before the number goes into a deck or a negotiation. The list is what turns a share into something another person can check.
The same discipline applies to any fake followers audit on Twitter: the percentage starts the review and the accounts finish it.
Active vs inactive
Active vs inactive is the share of followers who actively tweet against those who barely tweet. It is based on each follower's average tweeting frequency, not on the date of the last tweet.
The active share is also carried into the report's opening table as the ACTIVE FOLLOWERS column, so it sits directly beside the raw follower count.
Does inactive mean those followers never see the posts?
No. Inactive describes how often an account posts, not whether its owner reads. An account that rarely tweets may still read everything a brand publishes and may still be a customer.
Pew Research Center's work on Twitter lurkers describes the same group from the survey side: real people who use the platform and seldom post.
So the inactive share measures posting activity. It does not measure post visibility, and a high inactive share is a reason to look closer, not a count of people who are gone.
Ordinary vs overactive
Ordinary vs overactive separates followers who post at a normal daily volume from those who tweet far more than average per day.
What it leaves unproven: automation. High volume can come from a news desk, an enthusiastic fan or a script. Posting frequency alone does not identify spam, so the overactive list needs a look at content before any conclusion.
Quality tiers from high to low
Quality tiers sort followers into High, Medium and Low using three inputs together: activity, follower-to-following ratio and account age. Because they combine signals, they register problems that one share cannot show.
What they leave unproven: worth. A Low tier is not an instruction to remove anyone and not a statement about a person. For the owner-side view of that tier, see how to identify and remove low quality followers on Twitter (X).
Egghead: a default avatar and nothing more
Egghead is the count of followers still using X's default avatar. The report lists it as its own drill-down beside the other groups.
On its own it proves very little. A default avatar is one profile trait. It does not establish that an account is fake, inactive or unwanted, so it works only as supporting context for the other classifications.
The followers view and the following view
Every audience panel can be switched from the follower list to the following list. The Following view applies the same classifications to the accounts a competitor has chosen to follow.
It says nothing about the audience. Following-side shares describe the accounts a brand follows, not the people who follow the brand, so they never belong in a statement about competitor audience quality.
A quality score on one account: how a single Twitter profile is rated before you compare several.
Why the largest X audience in a set can have the weakest core
The largest follower list in a comparison can hold the smallest High tier. Follower rank and quality rank are separate orders, and they can run in opposite directions.
The documented sample export for this report shows the pattern. It was run on public X accounts, and the figures illustrate what the report showed on the day it was run, not the current state of any brand.
In a set of four large accounts, the one with the most followers carried a 34% suspected bot share, the highest of the four. Its High tier was 2%. Two smaller accounts in the same set reached 16% and 17%.
The biggest list had the weakest core, and no single chart showed it.
I read the tiers before the follower row for this reason. A ranking by followers and a ranking by High tier are two different tables, and only one of them is printed on a profile page.
Effective audience is the figure the classifications point to
Effective audience is the follower count read after the suspected bot share and the inactive share are taken into account. The report does not print it as one number. You work it out from the shares and counts it does print, with the tier split as the cross-check.
It is the one figure that can sit beside a follower count in a pricing or planning discussion. A rate card or a rival's boast quotes the total. Effective audience states how much of that total can respond, and the drill-down lists make the claim checkable.
A flat metric settles nothing
The second finding from the same sample is less obvious. Some audience metrics came back almost identical for every account.
Verified followers landed between 2.1% and 2.7% for all four. Active followers landed between 36% and 38%.
A metric that is flat across the set cannot rank the set. It ends that line of argument and sends you to the measures that do separate the accounts. In that sample those were the suspected bot share, which ran from 20% to 34%, and the High tier, which ran from 2% to 17%.
This cuts against a common habit. Many audits pick one figure, usually a fake percentage, and treat it as the answer. In a comparison, the first job is to find which figure varies. A share that is the same for everyone tells you about the category, not about the competitor.
Share and raw count change the verdict
Read every share with its account count. A smaller share of a larger list can be more accounts than a bigger share of a smaller one.
Worked through as arithmetic: 12% of 900,000 followers is 108,000 accounts, and 25% of 150,000 is 37,500. The account with the lower percentage holds almost three times as many flagged accounts.
The drill-down rows print both figures together for each compared account, so the check takes one glance.
How to check competitor audience quality on Twitter with Circleboom
To check competitor audience quality on Twitter, classify every account in the set with one method on one date, then read shares and counts before the follower total. Circleboom's X Competitor Analysis & Benchmark Report does the classification for up to 5 public accounts in one dated run. The reading takes five actions in two phases.
Sourcing is part of the answer. As a verified Enterprise partner of X, Circleboom retrieves the follower records through X's official APIs, so a figure you quote has a documented origin. Scraped collections can miss records, which is a poor base for a share.
Open the audience quality comparison for X accounts to begin.
Start one dated run for the whole set
- Open Circleboom Twitter Management and connect the X account you work from. That account can take the first slot of the comparison or stay out of it.
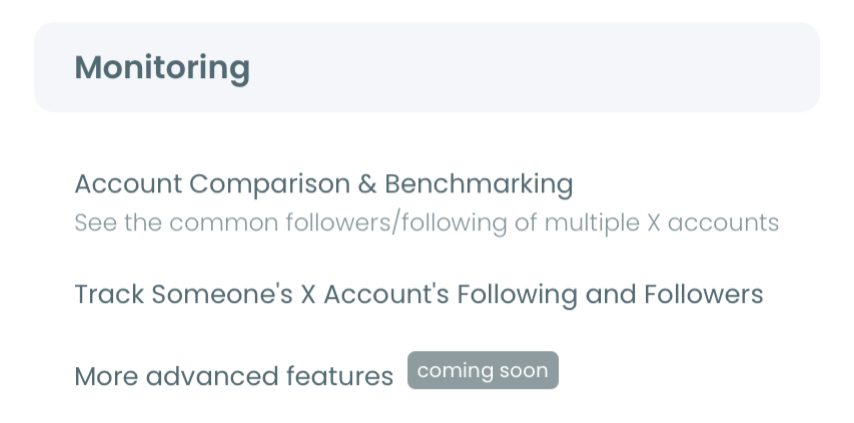
- Open the Monitoring menu and pick its first item, X Competitor Benchmark Report.
- Add up to 5 public handles and start the run. Use the + button for each extra slot, press Start Competitor Analysis, and pick a single report or a monthly schedule. Accounts above 3,000,000 followers cannot be added.
Read composition before size
- Read the four Audience Quality charts with the Followers view selected. Note which shares differ across the set and which are flat, then switch between percentages and values.
- Open The Accounts Behind the Numbers and select the Inactive tab. Each compared account gets a row with its share, its account count and a View all button. Repeat for the Fake/Bot tab.
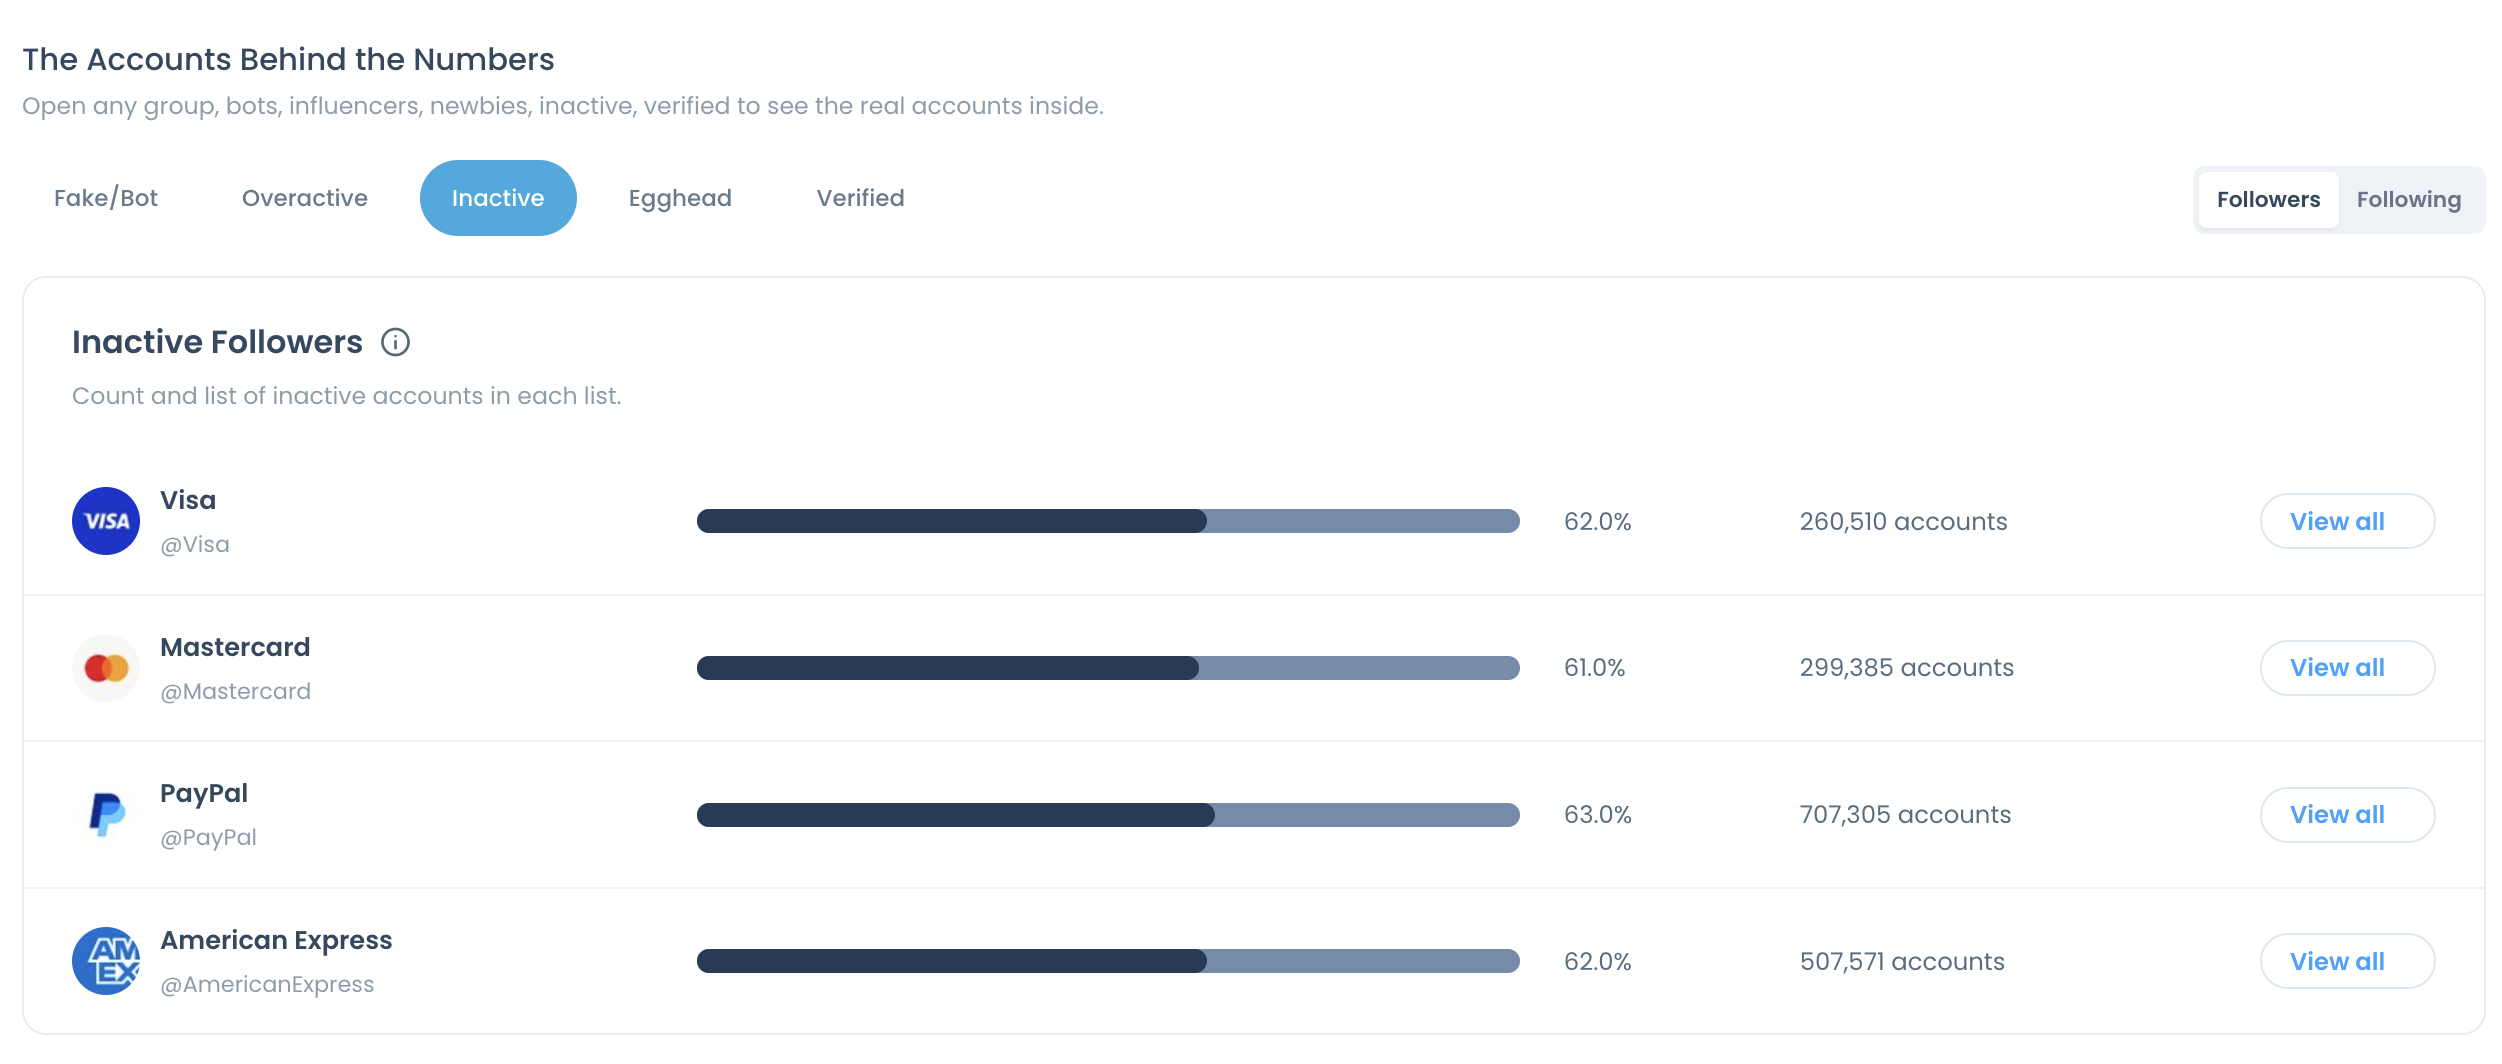
The follower count is read last, after its composition is known, so it cannot anchor the judgment. One run date for every account keeps the comparison on a single basis.
In short: one set, one run, four charts, the lists, then the follower row.
How to find Twitter accounts with a better audience when one turns out weak
When a competitor's or creator's audience reads as weak, replace the candidate and compare again. The slots in a comparison are not limited to rivals. They can hold candidate creators, up to 5 side by side.
The benchmark report does not search for new accounts. It has no influencer drill-down, and it reads only the handles you enter. Discovery happens in a different Circleboom tool: the influencer finder for Twitter is where requests for creators with reach or campaign partners are handled.
The working loop has three parts:
- Search for candidates in the niche.
- Put the shortlist into the comparison slots.
- Read bot share, inactive share and tiers for all of them on the same date.
A shortlist built this way argues from composition, not from rate cards. For the wider planning around a campaign, the post on influencer marketing tips is a useful companion.
One limit stays attached. The comparison describes an audience. It does not predict what a partnership will deliver.
A five-point check before you quote a follower count on X
A follower count becomes usable once competitor audience quality has been read beside it, and that reading has five parts. Before the number goes into a pitch, a contract or a target, run this list:
- Read the suspected bot share and the inactive share as both a percentage and an account count.
- Find the metrics that are flat across the set and stop arguing from them.
- Compare the High tier ranking with the follower ranking and note any inversion.
- Open at least one drill-down list and look at the accounts behind a share.
- Run the same reading on your own list with a Twitter follower audit.
The outcome is one of three decisions: pay for the audience, chase the rival, or drop the comparison because the follower lead does not survive the reading.
→ Compare competitor audience quality
What people ask about audience quality behind a Twitter follower count
Is there a faster way to vet one suspicious handle?
Yes. Circleboom's fake account checker for Twitter takes one username at a time and tells you whether that profile carries fake-account signals. It suits a spot check on a handle you doubt, and it says nothing about a whole audience.
What should we do if our own follower list has the same problem?
Add your account to the comparison and it is classified exactly like the others. For cleanup, review your own Fake/Bot, Inactive and Low-Quality follower lists, protect the contacts you recognize, and remove only selected accounts gradually through the Circleboom Chrome extension. The broader habits are covered in how to improve the quality of your Twitter account.
How often should a competitor's audience quality be re-checked?
Monthly is the built-in rhythm. Choosing Keep it up to date every month when you start the analysis produces a new dated report each month, and earlier runs stay available under Past Analyses so two readings can be compared.
Does the report show which followers two accounts have in common?
Yes, for two accounts at a time. The quality charts classify each account's own list and compute no overlap. The report's Common Audience panel takes any two compared accounts and shows the followers and followings they share, with view common followers and view common followings links. A pair that is not in a report belongs to a separate Circleboom tool for comparing two X accounts.
Does a high verified share mean a high-quality audience?
Not by itself. In my reading, the verified share is context: it shows which badge types are present, and it is no substitute for topic relevance, audience fit or observed interaction. Read it beside the tiers, not in place of them.