

Some tweets just feel different. Notifications coming in from accounts you have never seen before. Replies from people who do not follow you. The impression count still climbing an hour after posting, which almost never happens.
Something is happening. You just cannot tell what, or whether it actually means anything.
So you check the analytics on X. Some impressions, a like count, a repost number. I remember staring at those numbers and having no idea if they were good. Good compared to what? There was nothing to compare them against, no way to filter or sort, and the more detailed metrics were sitting behind a Premium subscription.
That is the gap Circleboom Twitter's Post Analytics fills. I started using it specifically for this reason. It pulls the full stats for every tweet directly from X's API and puts them in one dashboard.
How Can I Know If a Tweet Is Getting Traction?
A tweet is getting traction when multiple engagement signals are moving at the same time, not just likes, but reposts, replies, profile clicks, and impressions that keep climbing beyond your immediate follower base.
The clearest sign is that the tweet is reaching people who do not already follow you, which means someone found it worth sharing.
You can track all of these signals in detail with Circleboom Twitter's Post Analytics, which gives you a per-tweet breakdown of every metric that matters, sortable and filterable in one dashboard.

What Traction Actually Looks Like on X
Most people look at likes and stop there. Likes are visible, they feel good, and they are easy to count. But they are one of the weaker signals of real traction.
Here is what to actually watch.
Impressions still climbing after the first 15 minutes. A tweet's natural lifespan in the feed is short. If impressions are still going up 30 minutes or an hour after posting, the tweet is being retweeted or surfaced beyond your immediate followers. That is organic reach in action.
Engagement rate, not just raw engagement numbers. A tweet with 50 likes from 500 impressions is doing something very different from a tweet with 50 likes from 50,000 impressions. The first one is resonating. The second one reached a lot of people and did not move most of them. Engagement rate is the metric that tells you which one you are looking at.
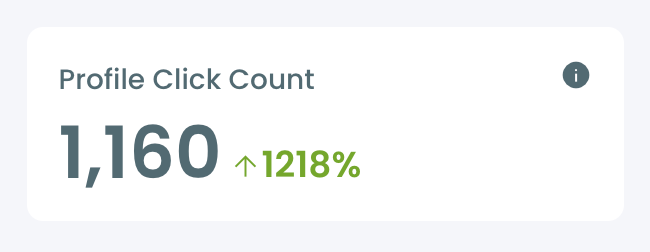
Profile clicks. When someone reads your tweet and then clicks through to your profile, they are not just passively consuming. They want to know more about who said this. That is intent, and it is a strong signal that the content triggered genuine interest.
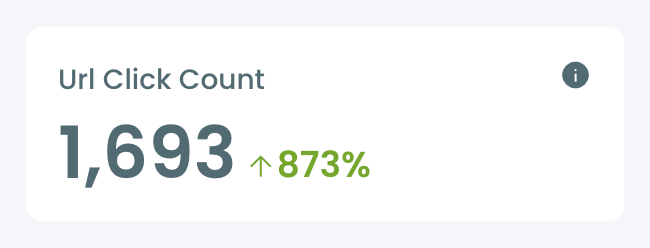
URL clicks. If the tweet included a link, clicks tell you the content was compelling enough to drive action beyond X. A tweet with high impressions and zero URL clicks got attention but did not convert it.
Reposts and replies. Reposts mean someone thought your tweet was worth putting in front of their own audience. That is the highest endorsement a tweet can get. Replies mean people had a reaction strong enough to respond. Both signals push the tweet further into the algorithm.
📌 A tweet with 10 replies and 20 reposts is often doing more for your account than one with 200 likes and nothing else.
What X's Native Analytics Shows and Where It Falls Short
X does give you per-tweet analytics. Tap into any tweet and you can see impressions, engagements, likes, reposts, and replies. That is a start.
The problem is what it does not show you. Without an X Premium subscription, the data is limited. And even with Premium, the native interface has no way to compare tweets against each other. There is no sortable dashboard. No filtering by engagement rate or click-through. No way to look across a month of content and ask which tweets actually landed.
You end up reviewing each tweet individually, which means you are looking at numbers without context. Knowing one tweet got 400 impressions tells you almost nothing unless you can see how that compares to everything else you have posted.
⚠️ Data without comparison is just noise. You need to see your tweets next to each other to understand which ones are actually working.
What Is Circleboom Twitter's Post Analytics?
Circleboom is an Official X (Twitter) Enterprise Developer. It accesses tweet analytics data directly through X's official APIs, which means the data is accurate, complete, and compliant.
No scraping, nothing unofficial.
What that means in practice is that Circleboom can surface metrics X's own interface buries or omits entirely, and present them in a way that is actually useful for making decisions.
🟢 Per-tweet metrics: Every tweet is shown with its full performance data. Impressions, engagements, engagement rate, likes, reposts, replies, profile clicks, URL clicks, video views, and video starts. All in one row, all comparable.
🟢 Sortable and filterable dashboard: Sort your tweets by any metric. Filter by date range, content type, language, keyword, media type, or performance threshold. Want to see your top ten tweets by engagement rate this month? Two clicks.
🟢 No Premium required: Circleboom gives you access to detailed tweet analytics through the official X API without needing an X Premium subscription. The data X locks behind a paywall is accessible through Circleboom's interface.
🟢 More structured than X's own view: X shows you one tweet at a time. Circleboom shows you all of them together, organized, sortable, and filterable, so patterns become visible instead of hidden.
🟢 Direct actions from the dashboard: From the same analytics view, you can add a tweet to a reshare queue, set it to auto-retweet, reschedule it for a different time, or use the built-in AI tool to rewrite it as a variation. You do not need to leave the dashboard to act on what you find.
It is not just a data view. It is a layer built on top of X's data that helps you understand what is working and do something about it.
How to Check Your Tweet Analytics with Circleboom Twitter
Step #1: Navigate to the Analytics Menu
From the left-hand menu, click on the "X AI WRITER FOR CREATOR + Post Analytics" tab, then select "Post Analytics" from the dropdown.
Within Post Analytics, select the "Post Engagement Analytics" option.
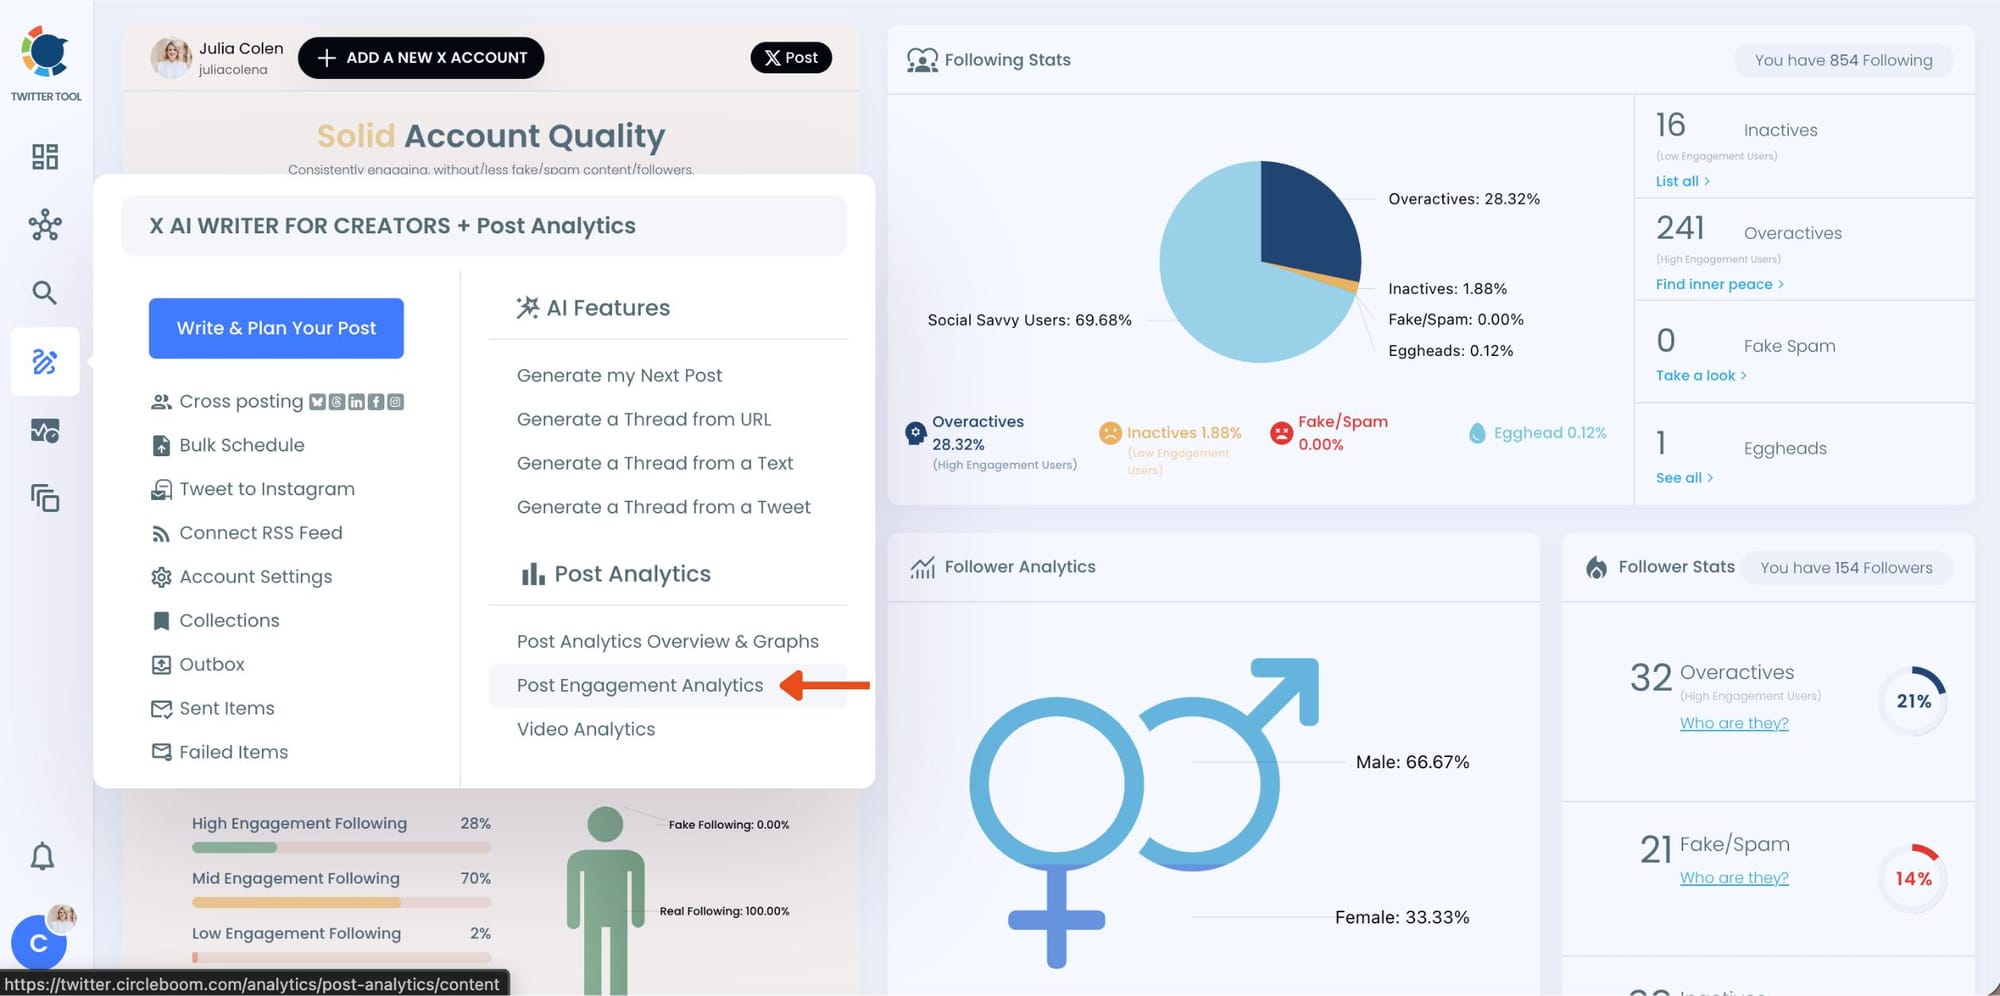
Circleboom will display a detailed breakdown of your posts, including metrics like impressions, likes, retweets, replies, and more.
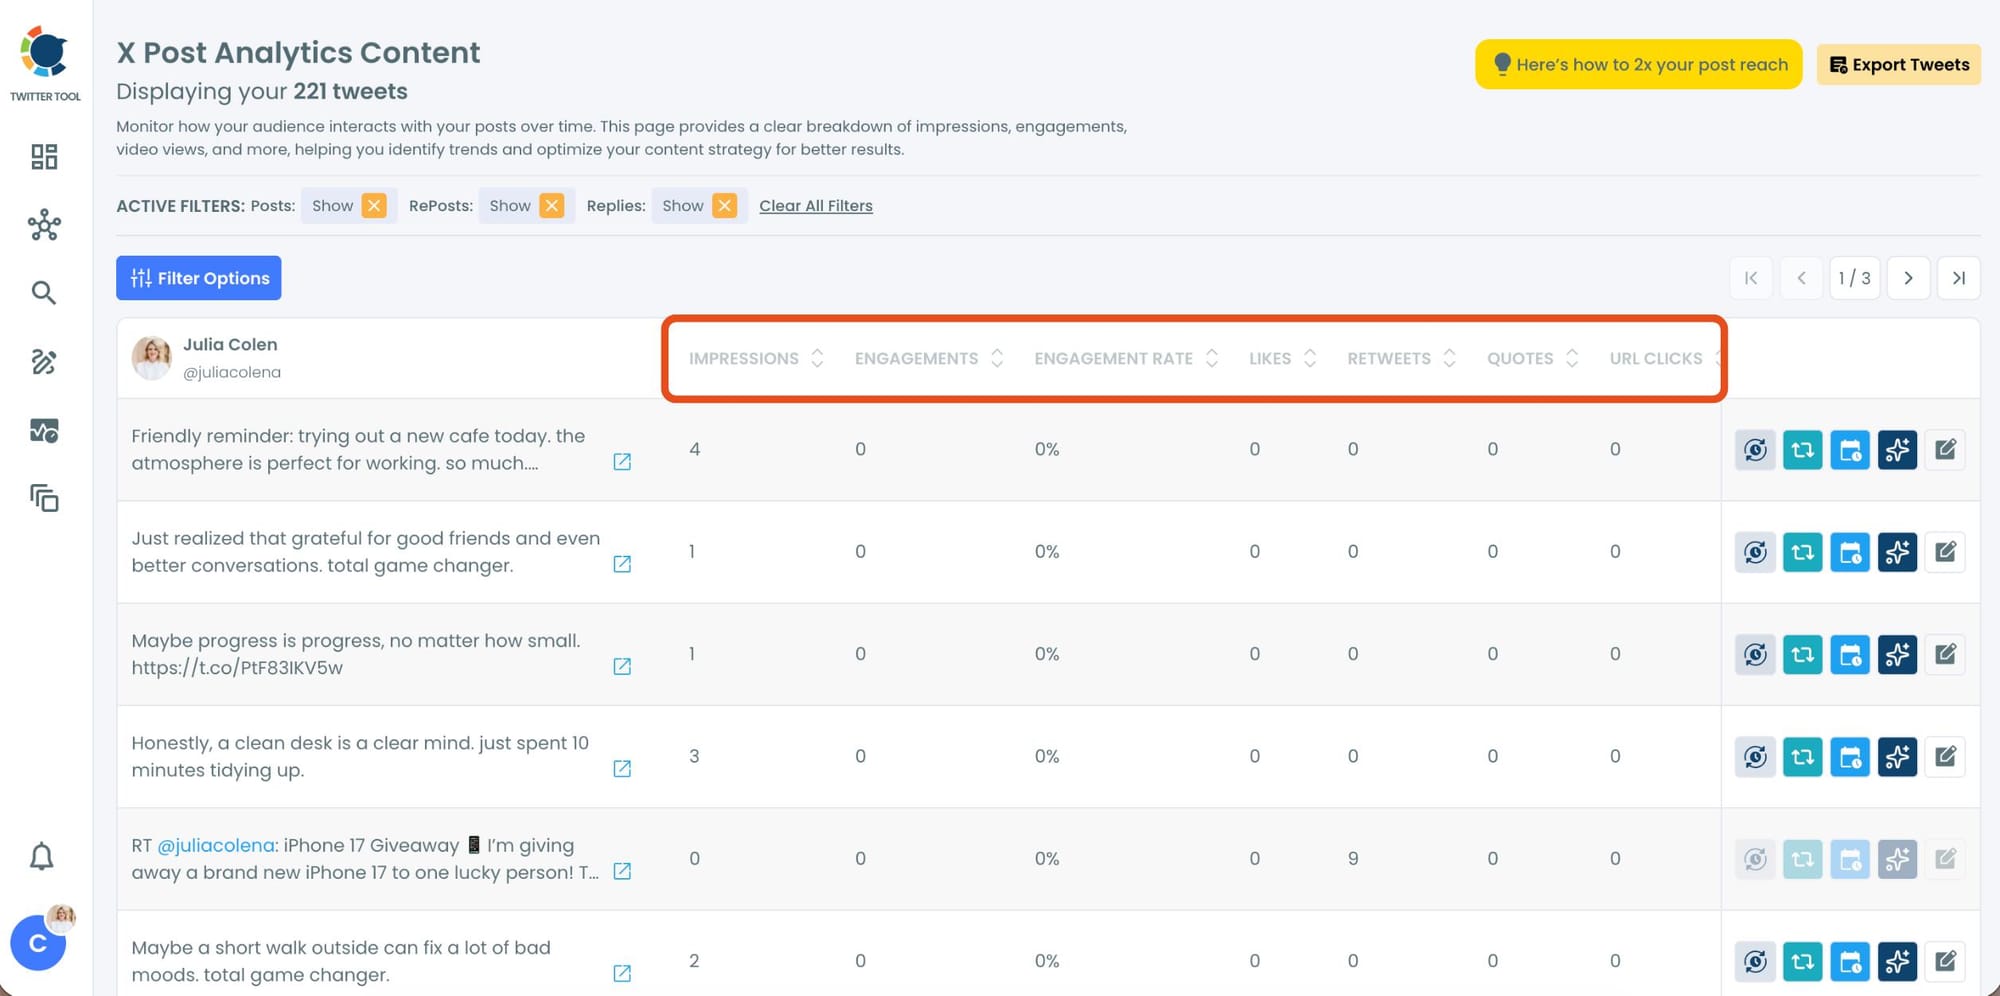
Step #2: Sort by Engagment
Now, you can sort your tweets for any stats you want. Let's say you want to find your most liked tweet and reuse it.
Locate the "Likes" column in the content list.
Click on the column heading, and Circleboom will automatically arrange your tweets from the highest to the lowest number of likes.
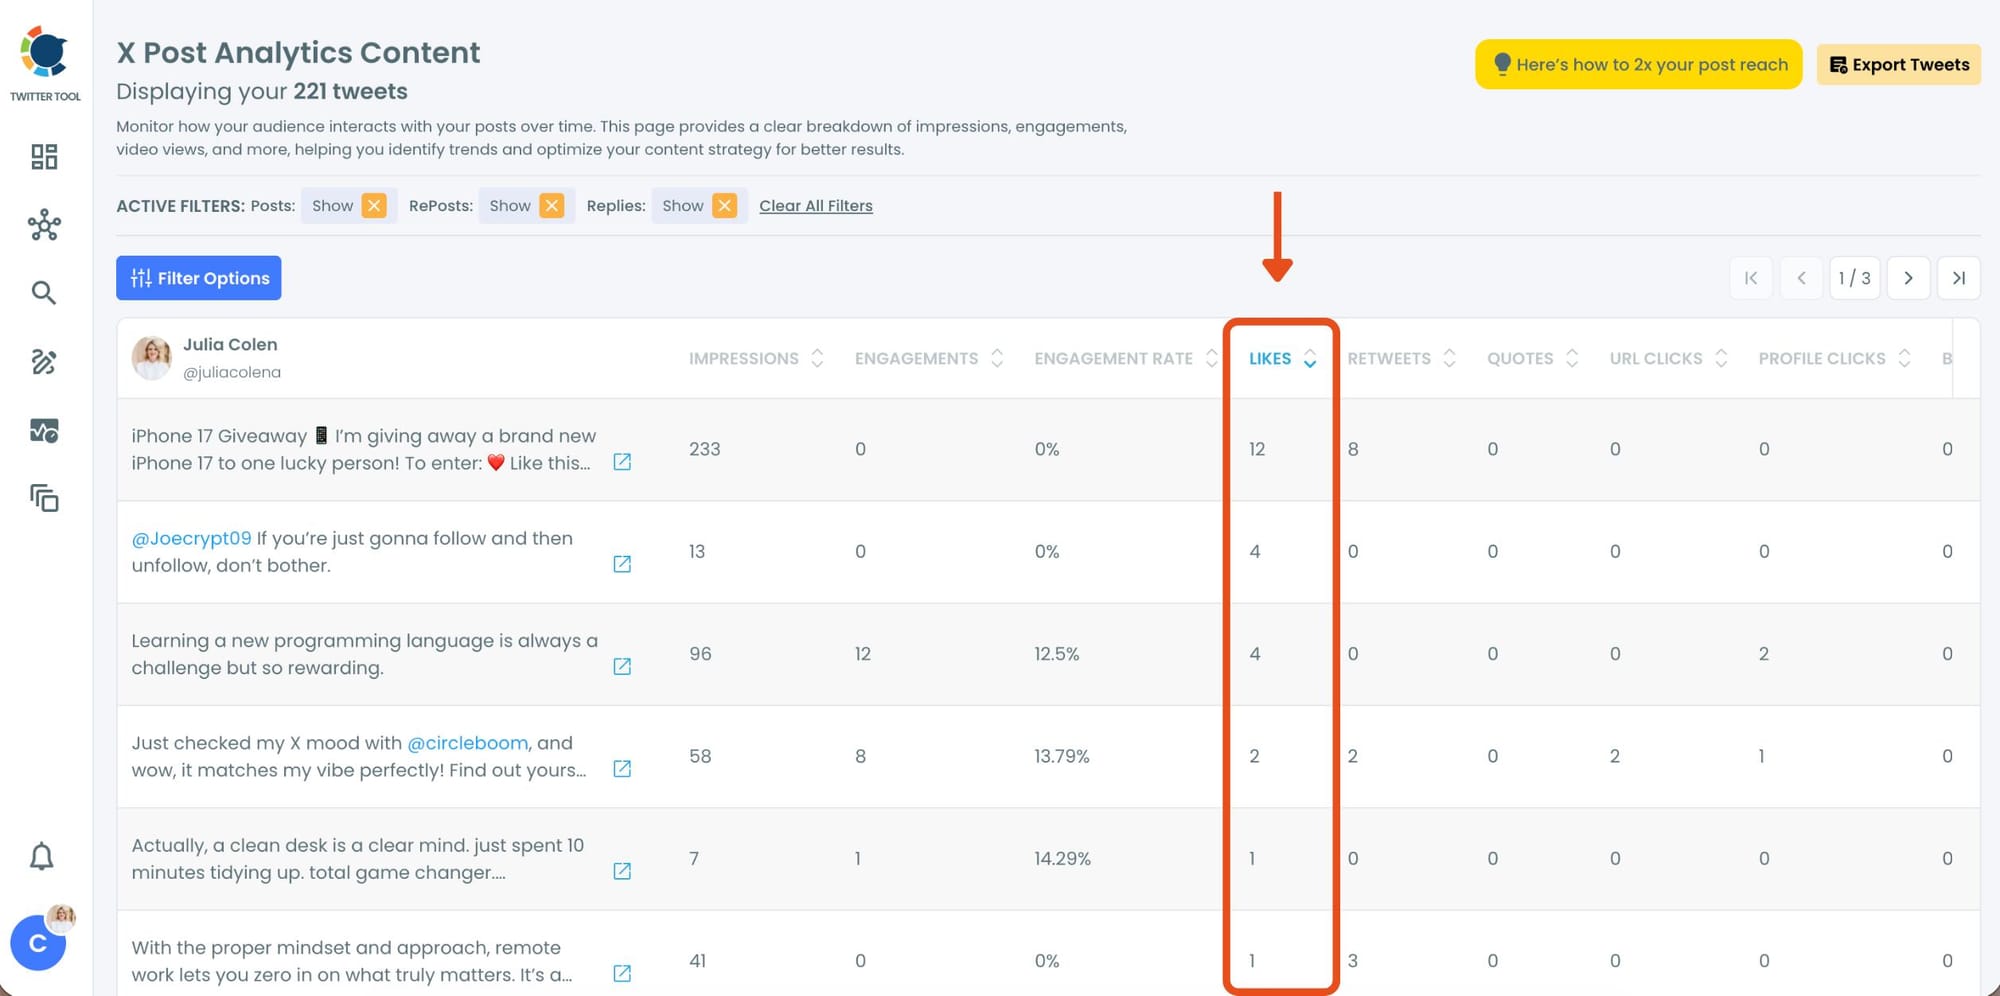
Here, you’ll instantly see your most popular tweets at the top, making it easy to identify which content performed best.
Step #3: Once you’ve found your old tweets, Circleboom offers several tools to make the most of them; choose which you want to use:

🟢 Reschedule Popular Tweets: Found a tweet that’s still relevant or hilarious but didn’t get the engagement it deserved?
With Circleboom, you can reschedule it to repost it at a better time.
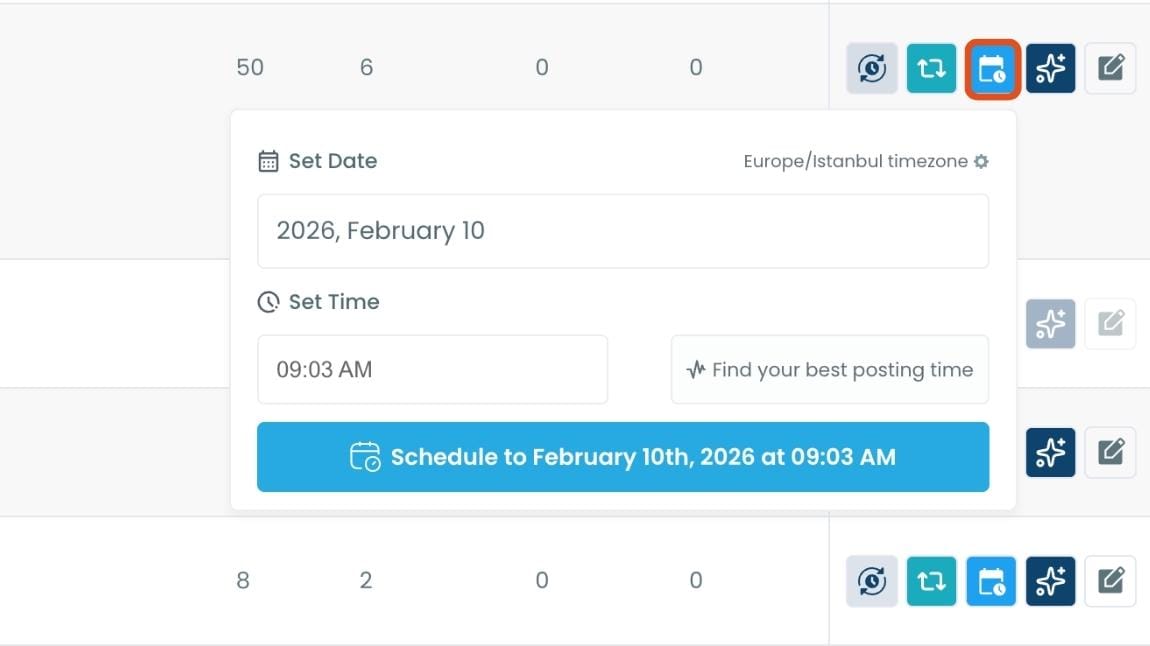
Maybe your audience wasn’t active when you first tweeted it, or perhaps it just got lost in the noise. Rescheduling ensures your best content gets a second chance to shine.
🔵 Refresh Content with AI: Some of your old tweets might feel outdated or could use a fresh twist. Circleboom’s AI-powered tweet generator can help you rewrite or improve them.
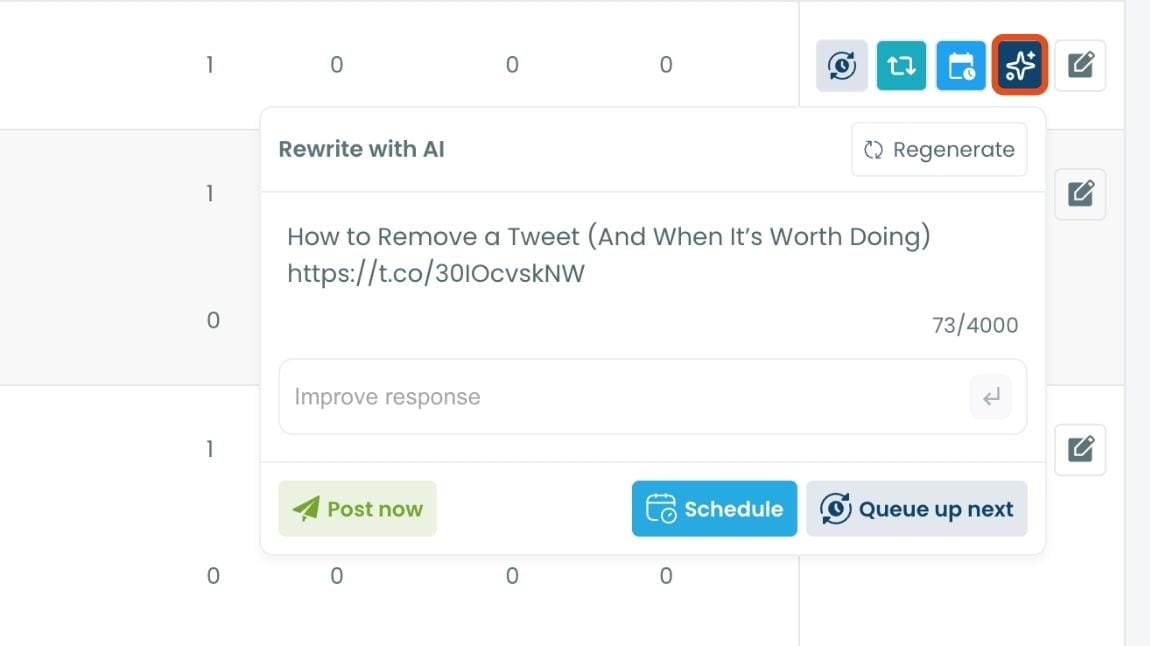
Whether you want to update the language, add a modern twist, or make it more engaging, the AI feature has got you covered.
🟡 Set Auto-Retweets: If you’ve got evergreen tweets that are still relevant, why not let them work for you on autopilot?
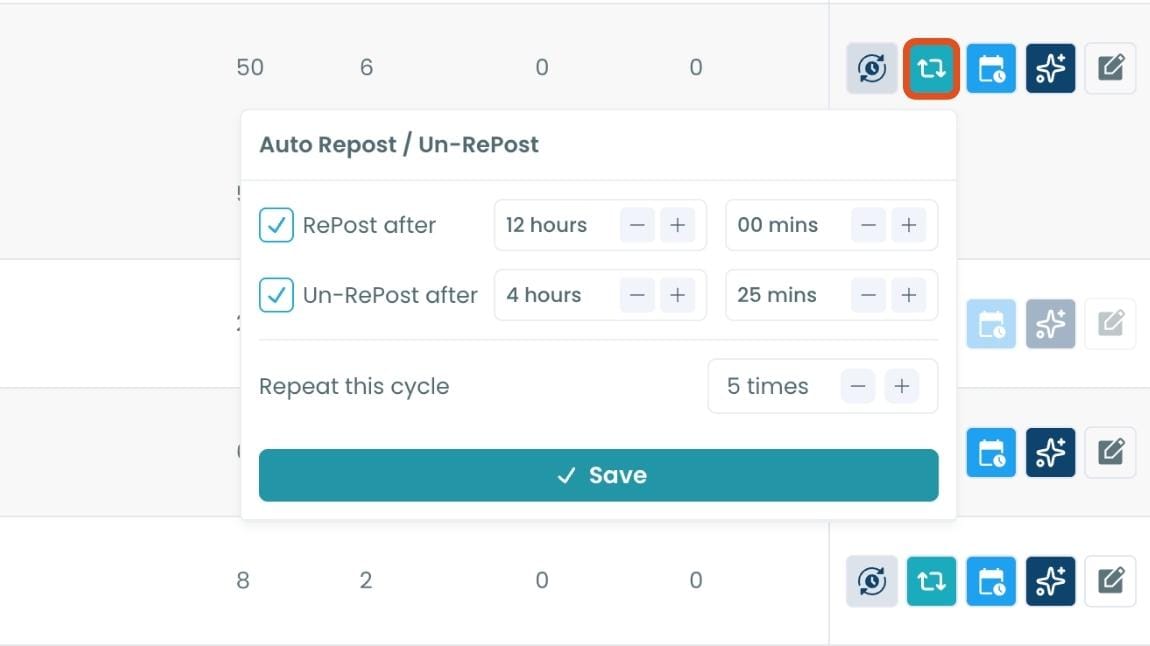
Circleboom’s auto-retweet feature allows you to automatically retweet your best-performing content at regular intervals.
This is perfect for driving consistent engagement without lifting a finger.
How to Use the Data to Understand What Is Working
Seeing the numbers is the first step. Knowing what to do with them is where the value actually lives.
Start with engagement rate, not impressions. High impressions with a low engagement rate means your tweet reached people but did not connect. High engagement rate, even on a smaller audience, means the content resonated. Those are the tweets worth understanding and repeating.
Pay attention to reposts. Out of all the metrics, reposts are the clearest signal that a tweet had traction. Someone liked it enough to put it in front of their own followers. Look at your highest-repost tweets and ask what they had in common. Tone, topic, format, timing. That pattern is your content strategy.
Watch profile clicks. When a tweet drives someone to visit your profile, the content created enough curiosity that they wanted to know more. That is a warm lead for a follow. If certain tweet types consistently produce profile clicks, you have found content that works for audience growth, not just engagement.
Use the overview graphs for trends. Circleboom's analytics overview shows your engagement and impression trends over time. If your engagement rate is climbing week over week, something in your approach is working. If it is flat despite consistent posting, the content type, timing, or both may need adjusting.
Act directly from the data. When you find a tweet that performed well, you do not have to leave the dashboard to do something with it. Add it to a reshare queue, set up an auto-retweet loop to extend its reach, or use the AI rewrite feature to create a variation and test whether the same idea lands in a different format.
FAQ
How can I know if a tweet is getting traction?
Look beyond likes. The clearest signals are reposts, replies, profile clicks, and impressions that keep rising after the first 15 minutes. A tweet is getting real traction when it is reaching people outside your existing followers, which means it is being shared or surfaced organically. Circleboom Twitter's Post Analytics shows all of these metrics together in one dashboard so you can see the full picture, not just the surface numbers.
What metrics actually show that a tweet is performing well?
Engagement rate is the most meaningful single metric because it accounts for how many people actually responded relative to how many saw the tweet. Beyond that, reposts show that people found the content worth sharing, profile clicks show that the tweet drove curiosity about your account, and URL clicks show that the content was compelling enough to drive action. Impressions alone tell you about distribution, not resonance.
Can I see tweet analytics without an X Premium account?
Yes. Circleboom Twitter gives you access to detailed per-tweet analytics through the official X API without requiring an X Premium subscription. You get impressions, engagement rate, likes, reposts, replies, profile clicks, URL clicks, and video metrics for all your tweets in a sortable, filterable dashboard.
Does Circleboom show more data than X's native analytics?
In terms of structure and usability, yes. X shows you one tweet at a time with basic metrics. Circleboom Twitter's Post Analytics shows all your tweets together in a filterable table, lets you sort by any metric, and surfaces patterns that are impossible to spot when reviewing tweets individually. The underlying data comes from the same official X API, but how it is presented makes a significant difference in what you can actually learn from it.
What should I do when I find a tweet that is getting traction?
Keep it in circulation. From Circleboom Twitter's analytics dashboard, you can add the tweet to a reshare queue, set up an Auto Retweeter loop to repost it at intervals, or reschedule it for a different time slot to reach followers who missed it the first time. You can also use the built-in AI rewrite tool to create a variation of the same tweet and test whether it performs similarly with a different angle.
How is engagement rate calculated on Twitter?
Engagement rate is calculated by dividing total engagements by total impressions, then multiplying by 100 to get a percentage. Engagements include any interaction with the tweet: likes, reposts, replies, profile clicks, URL clicks, and media clicks. A higher engagement rate means a greater proportion of people who saw the tweet did something with it, which is a more meaningful signal of content quality than raw engagement numbers alone.
Final Thoughts
Traction is not one number. It is a pattern across several signals that, taken together, tell you whether a tweet is just being seen or actually doing something.
The problem with checking traction on X is that the native interface makes it difficult to see those signals clearly, compare them to your other tweets, or act on what you find. Circleboom Twitter's Post Analytics puts everything in one place, goes deeper than X's own view, and does not require a Premium account to do it.
If you want to stop guessing which tweets are working and start knowing, that is where to look.


