Most X profiles report one audience number and nothing behind it. Follower count says how many accounts clicked follow, never how many of them are real, awake, or capable of engaging.
Circleboom closes that gap with a composition dashboard that takes about as long to read as a tweet.
What this walkthrough gives you.The exact path from login to the "Followers in a nutshell" dashboard inside Circleboom.A reading order for the four percentage splits so the worst one gets found first.The export options that turn the screen into a file for a report or a media kit.
Built on Circleboom's Followers' Characteristics analytics and delivered through official API access.
→ Twitter follower demographics
Why follower count is the wrong number to plan with
Follower count describes size, and every decision that matters describes composition.
Half of a 20,000-follower base can be dormant while the profile still shows the same round number as a base where nine in ten accounts post every week. The badge on the profile page cannot tell those two apart.
The digit is identical. The reach behind it is not.
That gap breaks four decisions at once:
- Content planning, because tone and topic depend on who is actually reading.
- Cleanup sequencing, because the biggest segment should be cleaned first.
- Partnership pricing, because a sponsor is buying reach, not a number.
- Credibility, because an inflated count is easy to check from the outside.
The most common symptom is an engagement rate that will not move. Good posts, steady cadence, flat numbers.
When a large share of followers stopped using X months ago, those accounts sit in the denominator of every engagement calculation forever and never appear in the numerator.
An X follower demographics dashboard resolves that in one screen, which is why it belongs before the content audit rather than after it.
Auditing the suspicious end of the audience specifically is a related job, and fake followers audit on Twitter covers how that pass is usually run.
What Circleboom's follower demographics dashboard reports
Circleboom groups the full follower base into four independent splits and presents them on a single screen titled "Followers in a nutshell."
There is no account list here and no table of usernames. The dashboard is a summary layer, and every value is a percentage of the whole audience.
The four groups are:
- Human vs Fake/Spam: the share reading as real accounts against the share showing suspicious or inauthentic signals.
- Active vs Inactive: the share showing regular platform activity against the share showing little or none.
- Ordinary vs Overactive: the share posting at typical volume against the share posting at unusually high volume.
- Ordinary vs Verified: the share without X verification against the share holding verified status.
Every classification comes from public profile data that Circleboom retrieves for each follower: display name, bio, follower and following counts, tweet count, account age, profile image, and activity history. Each account is scored on its own across the four dimensions, and the totals are then aggregated into the percentages on screen.
Nothing on this screen can be clicked into an account list, which surprises people expecting a filter panel.
The design assumption is that composition comes first and account-level work comes second, in a different part of the product.
The dashboard has no filters and no date selector.
That is a design decision, not a missing feature. It always reflects the complete current follower base, which is what makes it usable as a before-and-after measurement rather than a slice you have to reconstruct.
How to check Twitter follower demographics in Circleboom
A short video walks the same path if watching beats reading.
Watch the audience demographics walkthrough:
https://www.youtube.com/watch?v=IGqmRU4G-1M
The steps below run in three phases: connect the account, read the four splits in order, then save the reading and act on it.
Connect the X account you want to analyze
- Log in to Circleboom Twitter and authorize the X account whose audience is being analyzed.

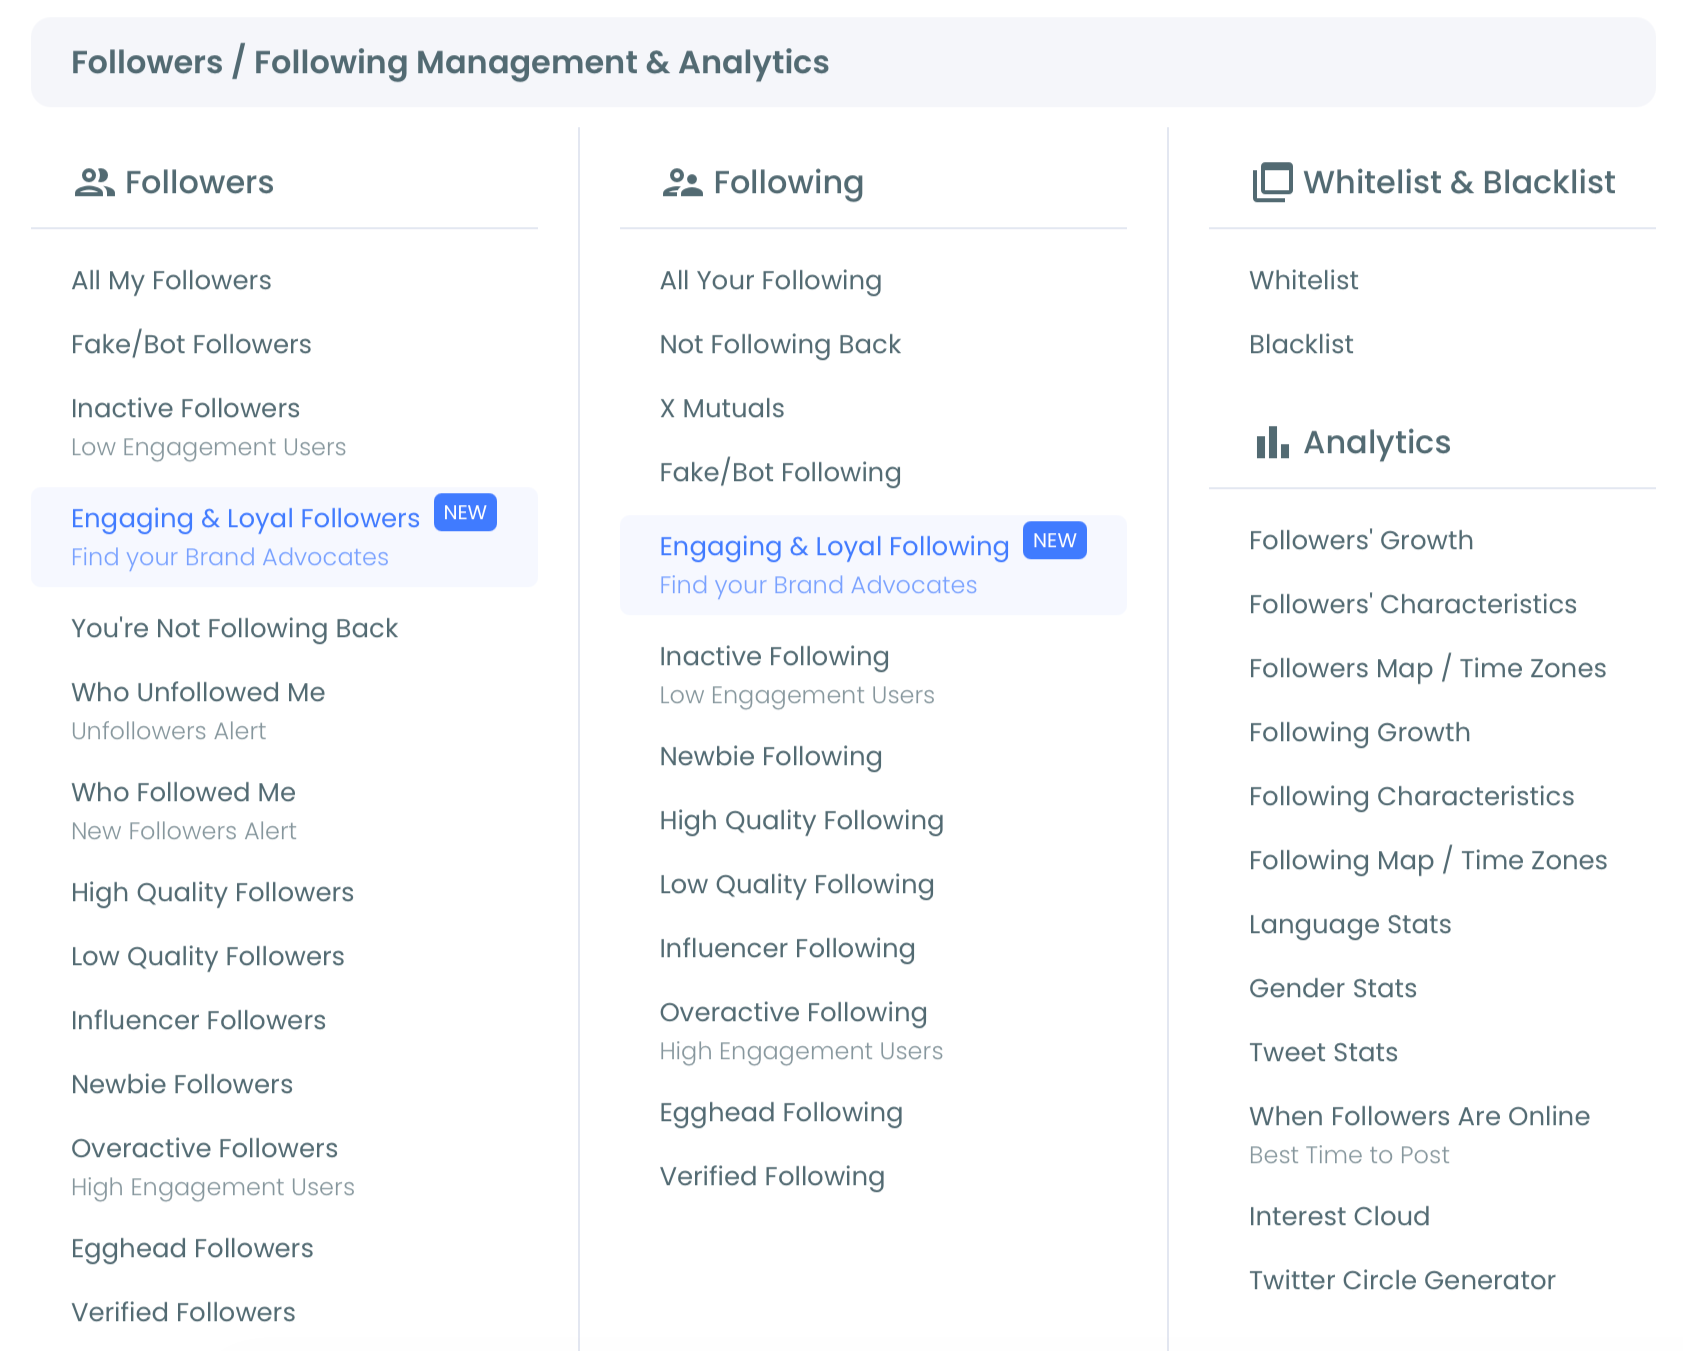
- Open the Follower and Following management and analytics menu. Every audience-level report Circleboom produces for the connected account lives under this menu.
Read the four splits in priority order
- Select the Followers' Characteristics dashboard from the analytics group. Circleboom retrieves the full follower list and classifies each account before drawing the view.
- Read Human vs Fake/Spam first. This split carries the loudest signal on the screen and decides whether authenticity is the problem before anything else gets attention.
- Read Active vs Inactive second. This is the split that explains a stubborn engagement rate, because inactive accounts cannot contribute to engagement no matter how the content changes.
- Read Ordinary vs Overactive and Ordinary vs Verified last. These two shape interpretation rather than urgency: overactive accounts flag automation or unusually loud community members, and the verified share indicates how much of the audience carries the badge.
Save the reading and move into the segment that needs work
- Export the dashboard with the three-dot button in the top right corner. PNG, JPG, and PDF are available, plus a browser print option for anyone assembling a printed report.
- Open the matching segment feature to act. The dashboard itself is read-only, so a high fake share leads to Fake/Bot Followers and a high inactive share leads to Inactive Followers.
That order holds up because it separates diagnosis from action.
The login earns authorized access to the follower list, and the menu step lands in the analytics layer instead of the action layer.
Reading before exporting means the saved file answers a question that was actually asked, and leaving the dashboard last keeps a bulk operation from starting before anyone knows which segment deserves it.
How to turn each percentage into a decision
Each split maps to a different next move, and reading them as one number wastes the screen.
A high Fake/Spam share points at cleanup before anything else. Inauthentic followers damage credibility in the exact conversations where audience quality gets checked, and X publishes its own position on inauthentic activity in its platform manipulation and spam policy.
A high Inactive share points at the engagement ceiling. Removing dormant accounts raises the ratio that every engagement metric is calculated against.
The practical mechanics of that pass are covered in can I remove inactive and spam followers on Twitter.
A high Overactive share points at interpretation rather than removal. Unusually loud accounts can be enthusiastic community members or automation, so the share is a prompt to look closer, not a verdict.
A strong Verified or Human share points at documentation. This is the reading worth exporting for a sponsorship pitch, because it converts a raw follower number into a composition claim.
Running the dashboard again after each of those moves is what makes the change measurable. You can rerun the Twitter follower demographics dashboard as often as you need, and the before-and-after pair is the evidence a cleanup actually worked.
Can you trust the classifications?
Treat them as directional intelligence, not as demographic truth.
Circleboom classifies each follower from behavioral signals: tweet patterns, account age, follower-to-following ratio, and profile completeness. X does not publish labels declaring which accounts are genuine, so any classification of this kind is inference from public evidence.
Two consequences follow from that. A long-standing customer who rarely posts will register as inactive despite being a real person with real intent. An account engineered to imitate ordinary behavior may register as human.
Both outcomes are expected from signal-based classification.
Private accounts add a further limit. They expose very little through the API, so they may be excluded from some dimensions or classified with lower confidence than public accounts.
There is also a freshness limit. The dashboard draws on data pulled at the moment it is opened rather than on a live feed, and suspensions, deletions, and deactivations keep shifting the base underneath it.
Rerunning after any significant growth or cleanup period keeps the numbers honest.
Circleboom holds standing as a verified Enterprise partner of X. Every follower record feeding these percentages is requested through sanctioned, policy-compliant channels instead of being lifted off public pages.
Completeness rides on that distinction: a scraper stops at whatever it manages to grab before X cuts it off, while an authorized pull returns the list in full.
Where demographics data ends and other reports begin
Followers' Characteristics answers composition questions, not identity questions.
It does not report age, location, occupation, or interests, and treating it as a full demographic profile overstates what four behavioral splits can carry.
Language distribution is a separate report, and Twitter language stats is where that breakdown lives.
Language skew changes posting time and tone more than most people expect. How to identify the most common languages among your Twitter followers works through why.
Gender distribution is its own view as well, published under gender on Twitter. The related walkthrough on how to analyze gender demographics of your Twitter followers sets out what that split is good for and where it stops.
Raw counts and growth curves sit in Twitter follower stats. The pairing is natural: the growth line says how fast the audience is arriving, and the composition read says what kind of audience it is.
Comparing all of this against the native app is worth doing once. How to check analytics on Twitter without premium lays out what the platform gives away and what it holds back.
Common mistakes when reading follower demographics
Four habits turn a useful dashboard into a misleading one.
Deciding from one split alone. A high inactive share is not the same problem as a high fake share, and a strong verified slice does not cancel either of them.
The four groups are independent readings, and a campaign decision built on a single percentage ignores three quarters of the screen.
Treating percentages as identities. The classifications describe patterns in public profile data, not people. Individual accounts should never be judged from these numbers, and nobody should be accused of anything on the strength of an aggregate.
Reading it once and never again. Composition is not a fixed property of an account. It moves with every growth event and every platform sweep, which is why rechecking after major growth or cleanup periods is the habit that keeps the reading useful.
Ignoring the mismatch signal. The most valuable thing the dashboard shows is often the gap between the imagined audience and the real one.
Wrong-audience targeting sinks more posts than weak writing does, and that gap is almost invisible from inside the drafting process.
Audience characteristics are worth feeding back into tone, topic choice, format, and partnership decisions rather than filing under analytics and forgetting.
Your next move
The whole reading takes one login and one dashboard, and it changes what every following decision is based on.
- Connect the account and open the Followers' Characteristics dashboard.
- Read Human vs Fake/Spam, then Active vs Inactive, then the remaining two.
- Export the view as a PNG or PDF so the current state is on record.
- Act inside the matching segment feature, then rerun the dashboard to measure the change.
Follower count will keep describing size no matter how long anyone stares at it.
Composition is the number that tells a strategy where to go.
→ Run your Twitter follower demographics report
What to know before you start
Does checking follower demographics change anything on the X account?
No. Followers' Characteristics is a read-only summary dashboard with no account-level actions, so nothing is followed, unfollowed, blocked, or removed by opening it. Every action happens later, inside the dedicated segment features.
How long does the analysis take?
It depends on how many followers the account has, since Circleboom retrieves and classifies the full follower list before drawing the dashboard. Larger audiences take longer, and the view appears once the classification pass finishes.
Can this be run on someone else's X account?
Followers' Characteristics analyzes the connected, authorized account. Analyzing another profile's audience is a different job handled by Circleboom's separate monitoring and follower-tracking features rather than by this dashboard.
What should be done first when several splits look bad at once?
Start with the largest segment rather than the most alarming one. A 5 percent fake share and a 40 percent inactive share point at very different amounts of work, and the inactive pass will move the engagement math further even though the fake number reads worse.
Why did the percentages change since last week?
Composition moves on its own. Suspensions, deletions, deactivations, and switches to private all reshape the base, while every new follower arrives carrying a fresh set of signals. Each run captures the audience as it stood at retrieval time, which is exactly why the before-and-after pair around a cleanup is worth keeping.