

The tweets with the most link clicks on Twitter are the ones actually sending people somewhere, and they are almost never the ones with the most likes. Likes measure applause. Link clicks measure intent. If your goal is traffic, signups, or sales, the click column is the only column that maps to it.
The problem is that X will not rank your history for you. It shows link clicks one tweet at a time, and only if you pay for Premium. To compare a year of posts, you would have to open each tweet by hand and write the numbers down yourself.
To find the tweets with the most link clicks on Twitter, load your full post history into a tool that can sort by the URL-clicks column, then rank every tweet from highest to lowest. Circleboom reads your per-tweet link-click data through official X access and sorts your entire archive by that one metric instantly.
→ rank your tweets by link clicks
X shows link clicks one tweet at a time. Ranking your whole archive is a different job, and it changes what you write next.
Why Link Clicks Beat Likes for Traffic
Link clicks tell you which posts converted attention into action. A tweet can collect hundreds of likes and send nobody to your site, while a plain-looking tweet with a sharp call to action quietly drives the traffic that pays the bills.
That gap is the whole reason to look. When you sort by URL clicks instead of likes, a different set of posts rises to the top, and that set is your real content strategy hiding in plain sight.
Circleboom groups every post's impressions, likes, reposts, replies, bookmarks, and URL clicks in one table. You can rank by any of them and find your most-clicked tweets in seconds, without leaving the dashboard to cross-check anything.
Most creators never see this view. X's native dashboard reports per-tweet numbers, and its own tweet activity dashboard is built for single-post inspection, not full-history ranking. Reading a thousand posts one at a time is not a workflow anyone sustains.
Circleboom is an official X Enterprise Developer company, so the link-click data comes straight from X's sanctioned pipeline, not from scraping or guesswork. That matters when you are about to make content decisions on the strength of these numbers.
How to Find the Tweets With the Most Link Clicks on Twitter
To rank your link clicks, connect your account through official access, open the engagement view, and sort the URL-clicks column from highest to lowest. The flow below runs in two phases and takes a few minutes.
Connect your account and open Post Analytics
- Log in to Circleboom Twitter and connect your X account with official OAuth.

- Go to the X Post Planner menu where Circleboom keeps its posting and analytics tools.
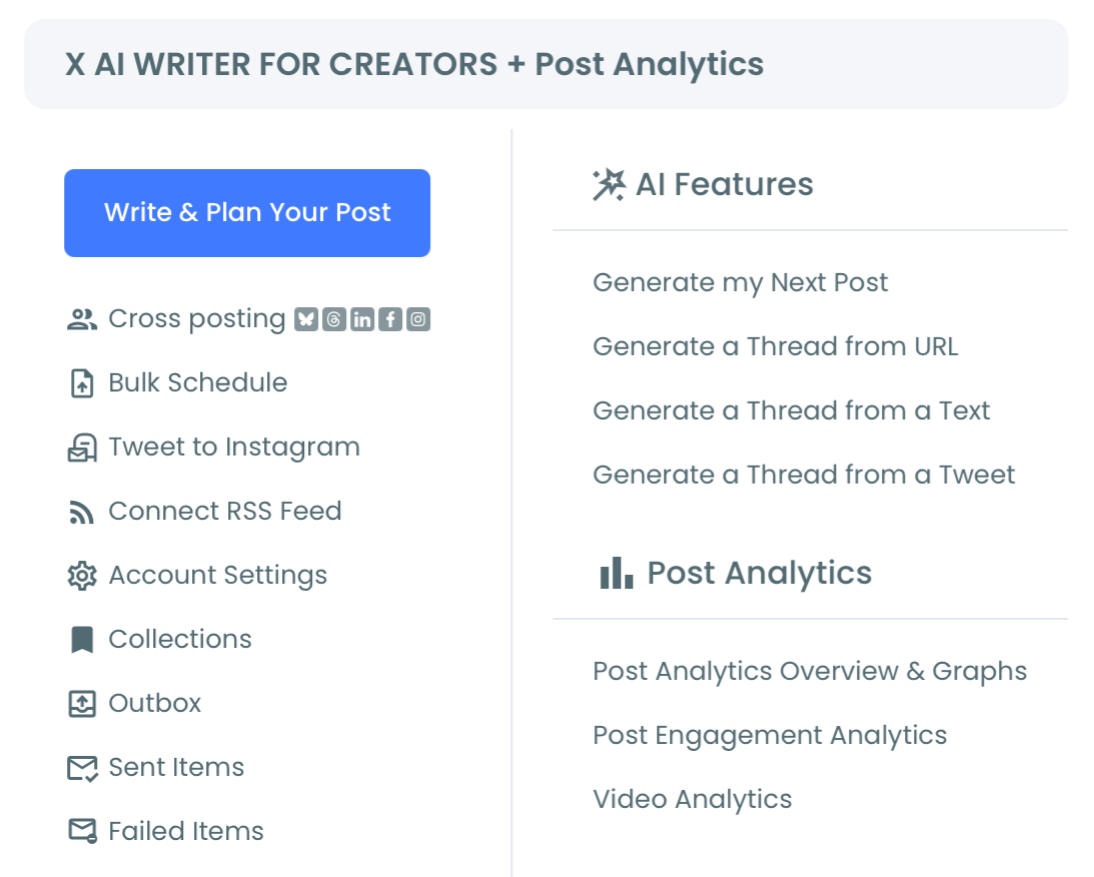
Rank and read the URL-clicks column
- Open Post Analytics, then the Engagement Analytics view to load every accessible tweet as a sortable row.
- Click the URL Clicks column header to order the whole table from most link clicks to fewest.
- Apply filters by date range, media type, or keyword to narrow the view to a campaign or a topic.
- Open your top posts and read what they share: the hook, the link placement, the promise made before the click.
That order works because each step removes noise before the next one acts. The login earns official access, the column sort ranks the full archive at once, and the filters isolate the pattern you actually want to copy. Skip the sort and you are back to reading posts one by one.
At a glance: connect, open Engagement Analytics, sort URL Clicks, filter, then study the top rows.
Video walkthrough: how the URL-clicks column ranks your whole archive so your top traffic tweets rise to the top of one table.
What the Ranking Actually Teaches You
Your top link-click tweets carry a repeatable formula. Once the ranked list loads, the shared traits get obvious fast: a specific promise, a link placed early, and a reason to click that the reader believes before they tap.
Compare that against your most-liked posts and the contrast does the teaching. A tweet built for applause and a tweet built for clicks are structured differently, and the ranking shows you which structure your audience rewards with action. This is where what to tweet based on past post analytics stops being a guess and becomes a decision backed by your own numbers.
Picture two posts from the same week. One opens with a witty line and drops the link on the fourth row; it collects 500 likes and 30 clicks. The other states the payoff first, then the link on the opening line; it collects 80 likes and 400 clicks. Side by side in the ranked table, the lesson is not subtle. The audience rewarded the second shape with the exact action a link is posted to earn, and it punished the first with silence dressed up as applause.
Pay attention to link placement too. Posts that front-load the link often out-click posts that bury it under three lines of setup, and the ranked table makes that habit visible across dozens of tweets at once rather than one anecdote at a time. If you want the wider metric picture, the key Twitter performance metrics you should track sit one tab over and show where clicks fit among the numbers worth watching each week.
Turn the pattern into a reuse loop
From there, the reuse loop is simple. Reschedule the proven links, rewrite the near-misses, and stop repeating the shape that never drove a click. For the engagement-rate angle behind those near-misses, how to identify your most engaging tweet on X walks through the rate-versus-volume trade-off so you can tell a weak hook from a weak audience.
To watch link performance over time instead of as a snapshot, track link clicks on X keeps the trend line in front of you rather than a single day's total. The Post Analytics dashboard gives the account-level view when you want the summary that sits above the per-tweet rows.
For the single-post angle, the Tweet Stats report feeds the same picture down to one tweet at a time, which is useful when a client asks about one specific post rather than the whole month.
Consider the math for a moment. If you post twelve links a month and only three of them ever drive meaningful clicks, ranking makes those three visible in one sort instead of buried among the other nine. Repeating the shape of those three, and dropping the rest, changes what your feed does for your traffic without adding a single extra post to your week.
The Bottom Line
Ranking by link clicks turns a vague sense of "what works" into a short, ordered list you can act on. Sort the column once, read the top rows, and let the tweets that already drove clicks tell you what to write next.
Circleboom does the sort across your entire post history and pulls the numbers through official X access, so you are reading real data, not a sample. That is the fastest path to knowing which content earns clicks instead of just likes, and it is the difference between guessing at your next post and building it on evidence.
→ Ready to pull your top link-click tweets? Start with the tweets with the most link clicks
FAQ
Can I see link clicks on Twitter without Premium?
Yes. X reserves per-tweet link clicks for Premium, but Circleboom reads the same URL-clicks metric through official X API access. It displays that number for your whole history, so you can rank tweets by link clicks with no X Premium subscription.
How far back does the link-click ranking go?
The official X API returns up to your most recent 3,200 tweets for a standard account, and Circleboom ranks every post in that window. Tweets older than that fall outside the return range, and impression-based rates may be missing for very old posts.
Why does a tweet with few likes have the most link clicks?
Because likes and clicks measure different behavior. A post can be enjoyable without being clickable, and a post can be clickable without being likable. Sorting by URL clicks separates the two so you stop judging traffic content by its applause.
Can I act on the top tweets from the same screen?
Yes. From the analytics view you can reschedule a strong link post, add it to a reshare queue, or rewrite it with AI before posting again, so the insight turns into a published tweet without switching tools.
How often should I re-rank my link clicks?
For most accounts, once a month is enough to catch a format that is starting to fade before it wastes a quarter of posts. If you are running a launch or a heavy campaign, a weekly sort keeps the top rows current while the numbers are still moving. The point is to re-rank on a rhythm rather than only when a post feels off, because a slow decline rarely announces itself in the like count.

