

The fastest way to find your best-performing tweets without X Premium is to pull every post into a sortable, filterable dashboard and rank them by engagement rate, not raw likes. That single shift separates guessing which tweets worked from knowing.
Circleboom lists every tweet from your X account in a sortable table with impressions, likes, replies, retweets, profile clicks, and engagement rate per post, pulled through official X Enterprise APIs. The dashboard lets you sort by any metric, filter by date, media type, or keyword, and act on the winners by resharing, rescheduling, or rewriting with AI. No X Premium required.
→ find your best performing tweets
The rest of this guide shows the exact dashboard, the sort discipline that actually surfaces winners, and the one metric most marketers ignore.
Why Does Finding Your Best Performing Tweets Actually Matter?
Most creators post dozens of tweets a week and never look back. That habit costs you twice. First, you spend hours generating new content while the proven winners sit dormant in your archive. Second, you lose the pattern recognition that separates a one-off viral tweet from a repeatable format you can run again.
X's native analytics give you a partial view. You can see your tweet analytics for a recent window, but account-level dashboards on desktop now sit behind X Premium, and even there the table view is shallow.
According to X's own post analytics help page, the data exists per post, but pulling it into a comparable list, sorting it, and acting on it is not a flow X provides natively.
That's the gap. A scattered archive of tweets isn't an asset until you can rank it, filter it, and recognize what your audience actually rewarded. Circleboom's Engagement Analytics dashboard closes that gap as an official X Enterprise developer, so the data comes from authorized API access, not scraping or workarounds.

The Metric Most Marketers Get Wrong
Likes are the loudest signal and the least useful one for ranking content. A tweet with 200 likes from a 100,000-follower account underperforms a tweet with 80 likes from a 5,000-follower account, but a like-only sort hides that. Engagement rate is the only metric that compares posts fairly across time, follower count, and content type.
Engagement rate normalizes engagement against impressions. A tweet that got 10,000 impressions and 300 total interactions scored a 3% engagement rate. A tweet that got 1,000 impressions and 80 interactions scored 8%. The second tweet is the winner even though the raw numbers look smaller.
If you want a deeper breakdown of what counts as a good engagement rate on X, the per-post view in Circleboom shows you yours alongside the platform benchmark.
How to Find Your Best Performing Tweets with Circleboom
Circleboom is built as the official Twitter management platform for accounts that want to analyze and act on their content from one dashboard. Every tweet from your account appears in a structured table with impressions, engagements, engagement rate, likes, reposts, replies, profile clicks, URL clicks, and video starts, all in one row per post.
That table is sortable, filterable, and actionable. You can sort by engagement rate to find true performance leaders, filter by media type to see whether videos or images carry your account, or scope to a date range to evaluate a specific campaign. Once you find the winners, the same dashboard lets you reshare, schedule, or rewrite them with AI without leaving the screen. The full Twitter post analytics dashboard sits inside the broader Circleboom Twitter suite, which is listed on X's enterprise customer directory, so your account stays compliant with X's terms while you work.
Here's the practical workflow, in order.
Video walkthrough: how the Engagement Analytics dashboard sorts every tweet by impressions and engagement rate side by side.
Connect your X account to Circleboom
- Log in to Circleboom Twitter and authorize with official OAuth.

- Open the X Post Planner menu from the left sidebar.
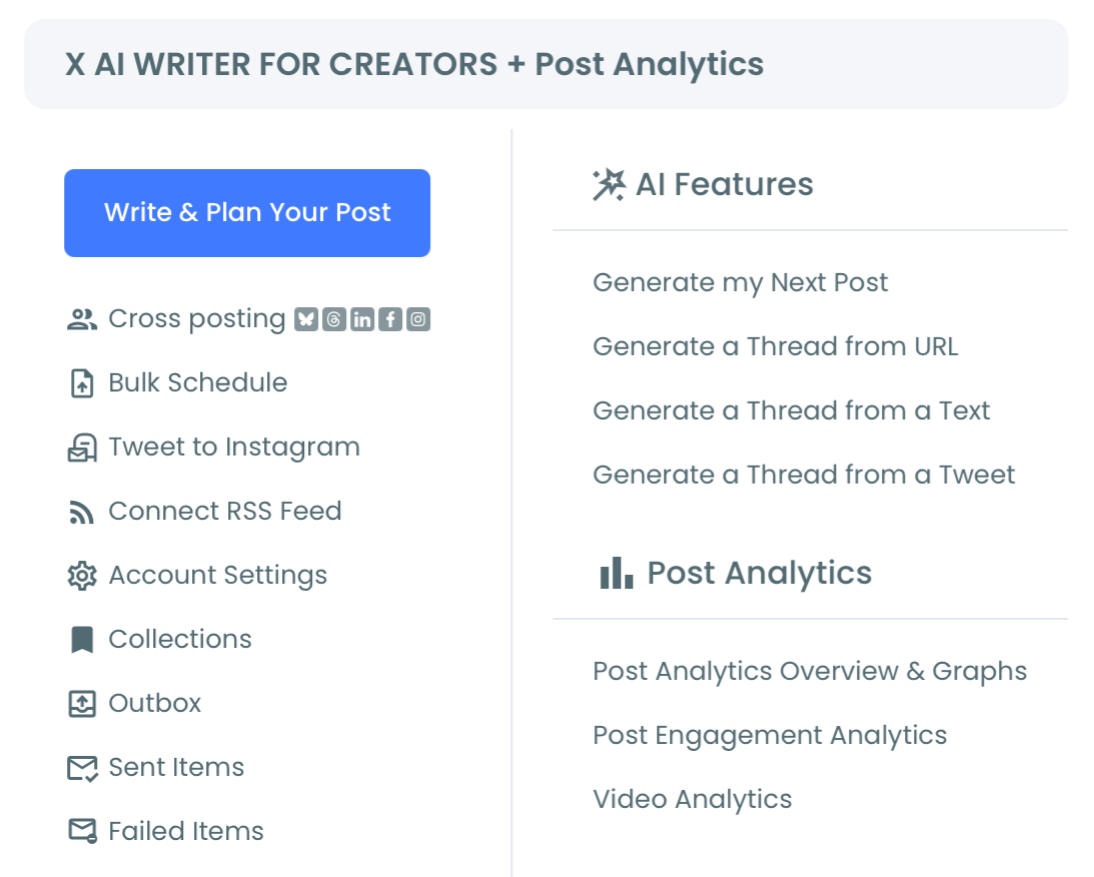
- Select Post Engagement Analytics to load every tweet from your account into the sortable table.
- Sort the table by engagement rate (high to low) and apply filters for date range, media type, or keyword to scope the view to the slice you care about.
That sequence is what makes the workflow hold up. The login earns official-API access first, the menu navigation gets you to the right surface, and the sort-then-filter order matters: sort by the metric that ranks tweets fairly, then narrow to the segment you're evaluating. Doing it in reverse hides your real winners.
You can see which tweets actually worked in about two minutes once the dashboard is loaded, and every decision you make from there (reshare, reschedule, rewrite) compounds across your next fifty posts.
What You Get When You Find Your Winners
Once your best performing tweets are surfaced, three things become possible that weren't before. You can sort tweets by likes and find your most engaging content to validate which formats your audience rewards. You can spot patterns across the top 20 tweets (short text vs. threads, image-led vs. text-only, question-format vs. statement) and turn those patterns into a content brief for the next quarter.
And you can act directly: reshare the proven winners on an Auto Retweet cycle to reach time zones you missed the first time, or rewrite them with AI in a different voice to test variations.
The compounding effect is real. A creator with 10,000 followers who reshares their top 5 tweets each month on a rotating schedule gives those posts another impression cycle without producing anything new. Pair that with Impression Analytics and you start to see which content keeps earning impressions weeks after publish: the ones that don't are candidates for rewrite, the ones that do are candidates for amplification.
Most accounts skip this step entirely and wonder why their growth feels flat. The fix isn't more tweets. It's increasing impressions on the tweets you already have by recognizing and recycling the winners.
There's a second compounding move most accounts miss: format consolidation. Once the dashboard surfaces your top decile by engagement rate, you can ask a sharper question than "what did well?" You can ask "what format earned this engagement?" If your top tweets are 80% short observational text and 10% threads and 10% image quotes, that's your content calendar for the next 90 days right there.
The Engagement Analytics view also exposes the per-post profile-click metric, which is the leading indicator for follower growth, while likes and impressions are lagging indicators of distribution. Watching profile clicks per top-decile tweet tells you which content actually converted attention into audience, not just signal.
The other practical use of the dashboard is post-mortem analysis on campaigns. When you've run a coordinated push (a product launch, an event, a content series), filter to that date range and you get a clean view of which posts in the campaign actually pulled their weight and which ones were filler. The insight feeds directly back into the brief for the next campaign instead of being lost in your timeline.
The Bottom Line
Finding your best performing tweets without X Premium is a sort-and-filter problem, not a data-access problem. The data exists per post in your account history. The question is whether you have a tool that can rank it by engagement rate, surface the patterns, and let you act on the winners in one move.
Circleboom does that as a verified Enterprise partner of X, pulling every post through authorized API access and giving you a dashboard X's native analytics doesn't.
Stop guessing which tweets worked. Sort the table, find the patterns, and turn your archive into an engine.
→ Spot your top-performing tweets in minutes
Frequently Asked Questions
Can I see my best performing tweets without paying for X Premium?
Yes. Circleboom pulls every tweet from your X account through official Enterprise API access and presents them in a sortable, filterable dashboard with impressions, engagement rate, likes, reposts, replies, and click metrics per post. The full engagement breakdown is available regardless of your X Premium status.
What's the difference between sorting by likes and sorting by engagement rate?
Likes measure raw interaction count, engagement rate measures interaction relative to impressions. A tweet with 80 likes on 1,000 impressions (8% engagement rate) is a stronger performer than a tweet with 200 likes on 100,000 impressions (0.2%). Sorting by engagement rate surfaces tweets that genuinely resonated with the audience that saw them.
How far back can I analyze my tweets?
Circleboom retrieves your account's available tweet history through X's API. Older tweets may have partial metrics depending on when X started exposing them, but the full sortable table covers your active analytics window.
Can I take action on a top-performing tweet directly from the dashboard?
Yes. From the same Engagement Analytics view you can reshare a winning tweet, add it to Auto Retweet, reschedule it for a different time slot, or send it through the AI Tweet Rewriter to test a variation. The dashboard is built as an action layer, not a passive report.