

Your Twitter profile click stats are the count of people who saw one of your posts and clicked your name, @handle, or profile photo to look you up. On X, that action is logged as "profile clicks," and it is one of the clearest early signals that a post made someone curious about who you are. Circleboom surfaces this number as a summary card and a trend line inside its Post Analytics dashboard, pulled directly from X's first-party data.
Your Twitter profile click stats show how many people tapped through from a post to your profile, and Circleboom charts that count over any window from 7 days to a year using verified, first-party data access. That makes profile clicks readable as a trend, not just a one-day number.
→ Twitter profile click stats
Keep reading for the exact metric, where it lives, and how to read it without being fooled by short-range spikes.
What a Profile Click Actually Counts
A profile click is a curiosity click. According to X's own post activity dashboard documentation, a profile click is registered when someone clicks the name, @handle, or profile photo attached to your post. It sits one step deeper than an impression and one step shallower than a follow.
That position in the funnel is what makes it useful. An impression means the post was served. A like means the post landed. A profile click means the post did something rarer: it made a stranger want to know who wrote it. If you want to grow followers, profile clicks are the metric that tells you which posts are pulling people toward your identity, not just your content.
Most creators never separate this signal from the noise because X buries it. The native dashboard shows profile clicks per post, but reading a trend across three months of posting means clicking through tweet after tweet. That manual grind is exactly the gap a dashboard view closes. If you have ever tried to see your total impressions on X one post at a time, you already know why an aggregated view matters. You can pull the same aggregated view for your Twitter profile click stats in one screen.
Why Circleboom Is the Right Tool for This
Circleboom aggregates every profile-click event across your selected time range and plots it as a single trend line on Twitter/X through direct, first-party data access. Instead of eleven separate tabs, you get one chart plus summary cards that each carry a total and a percentage change against the previous period.
Two things make this reliable. First, the data is real: Circleboom is an official X Enterprise Developer company, so the numbers come straight from X, not from scraping or estimation. Second, the profile-click metric is available without an X Premium subscription, which is where the native analytics increasingly hides its depth.
Video walkthrough: how impressions and profile-level engagements plot together on one Circleboom trend chart.
https://www.youtube.com/watch?v=fqMJIGZg-ug
Ready to open your own numbers? You can pull your profile click analytics in under five minutes.
How to See Your Twitter Profile Click Stats in Circleboom
The flow moves from connecting your account to reading the trend, in two phases. There are five actions total, and the last two are where most people go wrong.
Connect your account and open the analytics dashboard
- Log in to Circleboom Twitter and connect your X account with official OAuth. The connection is read-only for analytics, so nothing on your account changes.

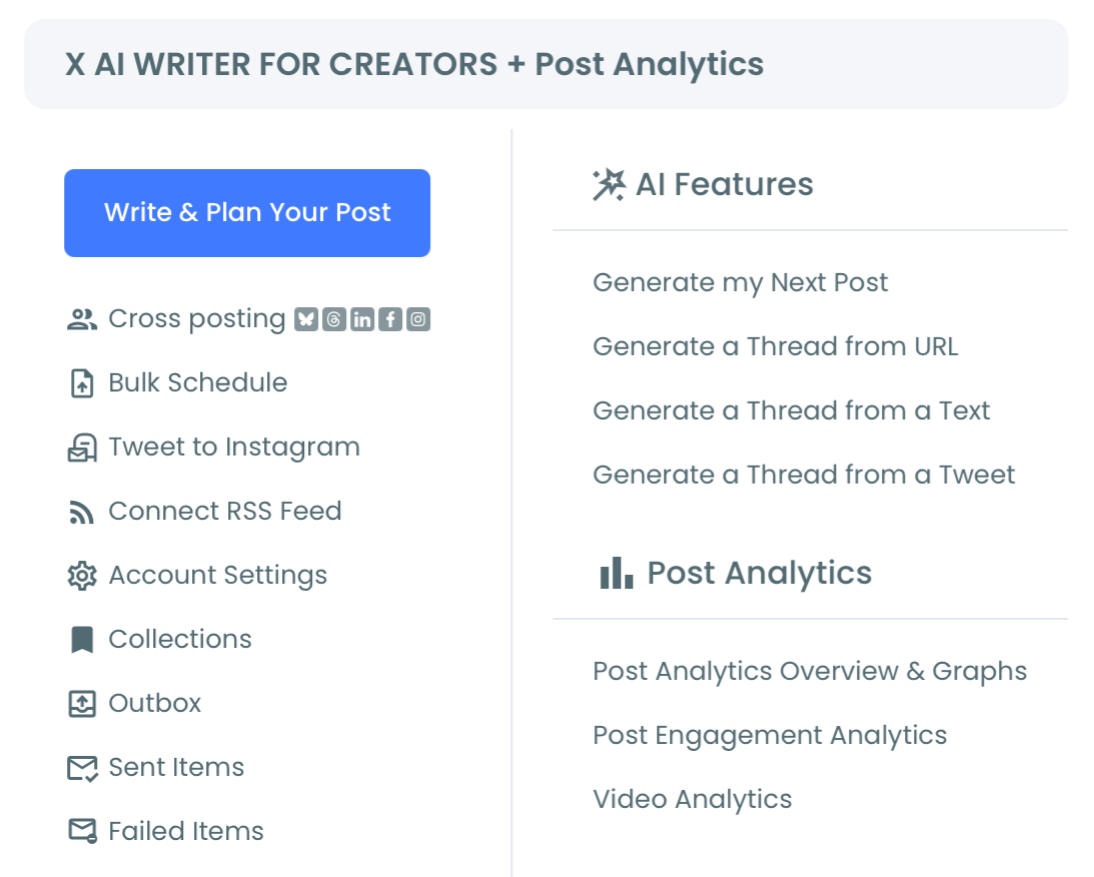
- Open the X Post Planner area and go to Post Analytics. This is the dashboard layer where trends live, separate from any posting or scheduling tools.
Read the profile-click trend, not just the total
- Select a time range from the presets (7D, 2W, 4W, 3M, 1Y) or open the calendar for a custom window. Longer windows give steadier signals.
- Choose Profile Click Count as one of the two Insights metrics. The chart plots two metrics at once, so pair Profile Click Count with Impressions to see how many views actually converted into curiosity.
- Read the summary card and the trend line together. The card gives you the total plus a percentage change (green up, red down, gray flat) versus the previous equal-length period; the line shows whether that change is a spike or a direction.
That order works because the login earns official-API data first, the dashboard isolates trends from posting tools, and pairing profile clicks with impressions turns a raw count into a conversion signal. Skip the pairing and you are left staring at a number with no denominator.
At a glance: connect, open Post Analytics, set the range, plot Profile Click Count against Impressions, read the trend. The pairing is the part that makes the number mean something.
Read Profile Clicks as a Rate, Not a Raw Number
Here is the insight most guides skip: a profile click total is close to meaningless on its own. Two hundred profile clicks off 400,000 impressions is a weak hook. Two hundred profile clicks off 8,000 impressions is a magnet. The ratio, roughly a profile-click-through rate, is the real content signal.
Here is a concrete way to read it. Say week one shows 12,000 impressions and 240 profile clicks, and week four shows 12,500 impressions and 410 profile clicks. Reach barely moved, but the profile-click rate jumped from 2 percent to over 3 percent, so the posts in week four were markedly better at converting a scroll into a look. If you want to isolate the reach half of that ratio on its own, the Twitter impression analytics view breaks impressions out separately.
Circleboom makes this readable because it plots Profile Click Count and Impressions on the same chart. When the profile-click line rises faster than the impression line, your content is getting sharper at making people curious, even if raw reach is flat. That divergence is the pattern worth chasing, and it is invisible in any single-post view. Pairing this with a look at what to tweet based on past post analytics turns the reading into a content plan.
One caution on the percentage cards: the comparison window is fixed to the immediately preceding period of equal length. A 7-day view compares this week to last week, and a single strong post can throw that number off. For anything you plan to act on, read the 4W or 3M trend. If your numbers look broken instead of noisy, the fixes in why you can't always see your tweet analytics usually apply.
What You Gain From Tracking Profile Clicks
Tracking profile click stats changes what you optimize for. Instead of chasing raw impressions, you start chasing the posts that convert views into profile visits, which is the real top of your follower funnel.
The payoff shows up in three places. You learn which content formats make strangers investigate you. You catch declines early, before they show up as a follower plateau. And you get a clean, chart-based artifact you can show a client without exporting spreadsheets. Once you know which formats pull those clicks, the tactics in improving your Twitter engagement rates help you turn that curiosity into replies, reposts, and follows.
For a wider set of numbers to pair with profile clicks, the full guide to Twitter analytics metrics maps how each one feeds the next, from impressions through replies to follows.
The Twitter Post Analytics hub sits right beside profile clicks, so you can move from one signal to the next without ever leaving the dashboard.
Summary
Your Twitter profile click stats measure curiosity: how many people a post pushed to look you up. Circleboom charts that count over any window through official, first-party data access, pairs it with impressions so you can read it as a rate, and flags the trend direction with period-over-period cards. Read the longer ranges, watch the profile-click line against the impression line, and you will know exactly which posts are recruiting your next followers.
→ Start reading your Twitter profile click stats
Frequently Asked Questions
Do I need X Premium to see profile click stats?
No. Circleboom pulls profile clicks and ten other metrics through official first-party data access, so you can read your profile click stats without an X Premium subscription.
What is the difference between a profile click and a profile view?
A profile click is logged when someone taps your name, @handle, or photo from a post to reach your profile. It is tied to a specific post's reach, whereas "profile view" is a looser term people use for total profile traffic from any source.
Why did my profile clicks jump on the 7-day view?
Short ranges compare against the previous equal-length window, so one strong post can distort the percentage. Switch to a 4-week or 3-month range for a stable read before you change strategy.
How many profile clicks is a good number?
There is no universal benchmark, because the count scales with your reach. Read it as a rate instead: divide profile clicks by impressions for the same period and watch whether that ratio climbs week over week. A rising profile-click rate on flat reach means your posts are getting better at making people curious, which matters far more than any absolute count you could compare against another account.
Can I change tweets from the analytics dashboard?
No. The Post Analytics view is read-only. It is built for reading trends, not editing, scheduling, or deleting posts, which keeps the analytics layer clean.
)
