"Work with a trusted X Official Enterprise Developer to expand what's possible for your business. Each Official Enterprise Developer has been selected for the program after an extensive evaluation, and represents excellence, value, and trust." — X (Twitter)
While impressions tell you how many saw your tweet, tracking engagement on X reveals how many people actually interacted with your content, encompassing likes, retweets, replies, clicks, and more. You might be asking, "how to check total Twitter engagement" for your profile, or "how many engagement do I have on Twitter" on a specific post?
Manually figuring out the number of engagement on Twitter for each tweet can be tedious, but Circleboom simplifies this, giving you a clear view of your overall engagement metrics and helping you easily identify "my most engaged tweet." Understanding and improving your engagement is vital for building a thriving community and amplifying your message on X.
SEE YOUR LIKED TWEETS
Knowing which of your tweets truly resonated with your audience is powerful. Circleboom helps you easily see your liked tweets, offering a clear overview of your content's popularity. You might be asking, "how do I find my most liked tweet?" or looking for a quick way to review "my most liked tweets" to understand what content performs best.
Our platform streamlines this, allowing you to pinpoint "my top tweets" by likes. This insight is invaluable, as these tweets have already proved their success with your audience. You can then leverage this data to auto retweet, reschedule, or even rewrite with AI your most liked tweets, significantly increasing their chances for more impressions and engagement by giving proven content new life.
TRACK URL CLICK ON YOUR TWEETS
It's vital to track URL clicks on your tweets because they directly show how much traffic your content drives to external sites. Ever wondered "how many URL clicks do I get from my tweets," or "how many clicks do my tweets get" overall?
Circleboom provides detailed analytics, highlighting "my most clicked tweets." Getting URL clicks is incredibly important as it signifies genuine interest, moving your audience to active engagement with your external content. By knowing which links perform best, you can refine your strategy and boost crucial off-platform traffic.
MY BOOKMARKED TWEETS
Understanding how your own content resonates enough to be saved by others is powerful. You might wonder, "how many people bookmarked my tweets?" or "how many bookmarks do my tweets have?" These metrics indicate content valuable enough for private saving. Circleboom helps you identify "my most bookmarked tweets," showing which posts users deem worthy of keeping.
These highly bookmarked tweets prove their value. With Circleboom, you can not only analyze this data but also manage your bookmarks. You can delete bookmarks in bulk, or more importantly, export bookmarks for an organized, offline record of your most impactful tweets. This lets you easily revisit and repurpose successful content, maximizing its future reach and engagement.
VIDEO VIEW NUMBERS
Videos are a powerful way to engage your audience on X, and understanding their performance is crucial for your content strategy. It's not enough to just post a video; you need to know how many people are actually watching. That's where video views on Twitter come into play. This metric tells you the total number of times your videos have been viewed, offering direct insight into their reach.
You're probably wondering, which are "my most viewed Twitter videos?" Identifying your top-performing video content is essential.
Circleboom provides detailed analytics on your video view numbers, allowing you to quickly see which videos are capturing the most attention. This insight helps you understand what resonates most with your audience, guiding your future video creation to maximize impact, drive more engagement, and boost your overall presence on X.
CIRCLEBOOM KEEPS YOU SAFE, ALWAYS!
Circleboom is the top choice for diverse users, spanning individuals, small businesses, corporations, and non-profits globally. What sets us apart? We strictly adhere to Twitter Rules, ensuring no actions that could jeopardize your account. Trust Circleboom for a secure and compliant experience on Twitter—you're in safe hands!
CHECK YOUR TWEET IMPRESSIONS
Ever wonder how many eyes land on your tweets? Checking your tweet impressions is key to understanding your content's true reach on Twitter. Impressions tell you how many times your tweet was seen, whether in timelines, search results, or elsewhere.
Circleboom makes it simple to discover how many impressions you have on Twitter for individual posts and provides your total impressions across all tweets. This helps you quickly pinpoint tweets with the most impressions, giving you valuable insights into what content truly resonates with your audience and how to improve your strategy.
WHAT IS TWEET ENGAGEMENT RATE?
The tweet engagement rate measures your content's effectiveness on X: "Of those who saw your tweet, how many interacted?" It combines impressions with engagement. How to calculate Twitter engagement rate: Engagement Rate = (Total Engagements / Total Impressions) x 100. Engagements include likes, retweets, clicks, etc.; impressions are total views.
Why is it important? A higher rate signifies highly relevant and captivating content, meaning your message truly resonates. This metric is crucial for refining your content strategy and growing an active following on X.
MY RETWEETED POSTS
Understanding which of your tweets resonate enough for others to share them is vital for expanding your reach on X. Circleboom makes it easy to track my retweeted posts, giving you clear insights into your content's virality. You're likely wondering, "which are my most retweeted tweets?" or aiming to identify your highest retweeted tweet to replicate its success. Our platform helps you quickly pinpoint the tweet with most retweets by providing a detailed overview of your past performance.
This isn't just about looking back; it's about strategizing for the future. Circleboom users can leverage these proven successes to reshare their most retweeted tweets, significantly increasing their chances for even more likes and retweets by giving highly popular content a renewed spotlight.
HOW MANY PROFILE VISITS DO I GET FROM MY TWEETS?
Understanding the journey your audience takes after encountering your tweets is vital, and a key step in that journey is a profile visit. You might be asking, "how many profile clicks do my tweets generate?" or simply, "how many profile visits do I get from my tweets?" This metric directly tells you how often your content piques someone's interest enough for them to click on your username and explore your profile further. This signifies a deeper level of engagement, as users are actively seeking more information about you, your brand, or your content.
Circleboom provides clear analytics on these valuable profile clicks, helping you identify which specific tweets are most effective at converting a casual viewer into a curious visitor, ultimately driving more interest in your overall presence on X.
MY MOST REPLIED TWEETS
While likes and retweets show appreciation and reach, replies represent the utmost level of engagement on X. When someone takes the time to reply, they're not just consuming your content; they're actively joining the conversation, signaling a deep level of interest and connection. Circleboom helps you quickly identify "my most replied tweets," giving you clear insight into the topics and posts that spark genuine dialogue among your audience.
This metric is incredibly important because it highlights your most effective conversation starters, allowing you to understand what truly resonates and encourages active participation. By knowing your top replied tweets, you can foster a more interactive community and create content that drives meaningful discussions.
VIDEO START ANALYTICS
While knowing your total video views is essential, understanding video start analytics provides an even deeper insight into your content's initial pull. The Twitter video start metric specifically counts how many times users began watching your video. It's a crucial indicator of whether your video's thumbnail, title, or the initial seconds successfully capture attention and encourage a play.
This metric is incredibly important because it reveals the effectiveness of your video's hook. A high number of video starts, even if not all lead to full views, signifies that your content is compelling enough to grab immediate interest in a busy timeline. By tracking video starts with Circleboom, you can identify which video intros or promotional tactics are most effective at converting a casual scroll into an active viewing experience, optimizing your video strategy for maximum initial engagement.
Content is king! If you don’t know your king, your content, performs on Twitter, you can’t keep your kingdom alive! So, Circleboom’s Twitter Content Performance Analysis provides you with every detail to measure the success of your X posts.
Circleboom is an official X Enterprise partner! So, your account and all the data you have are safe and secure with us!
2
02
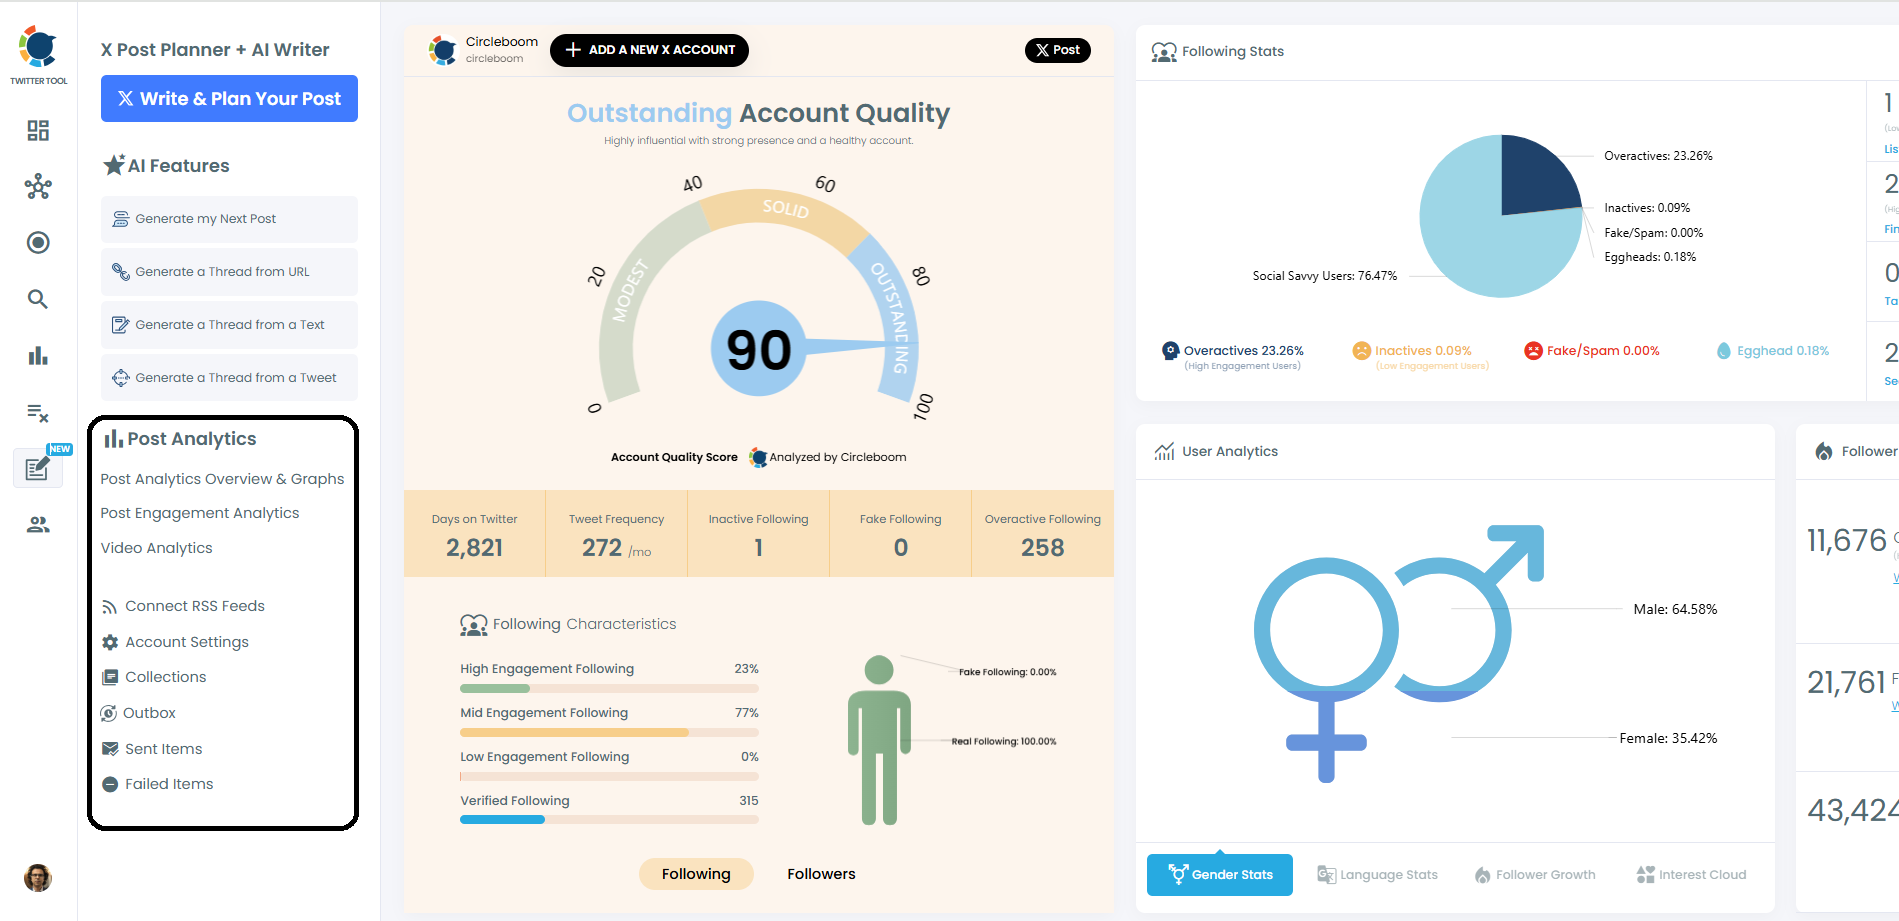
On the dashboard, open up the side menu.
You will see “Post Analytics”. Under there are three submenus: “Post Analytics Overview & Graphs”, “Post Engagement Analytics”, and “Video Analytics”. Let’s start with Analytics Overview and Graphs”.
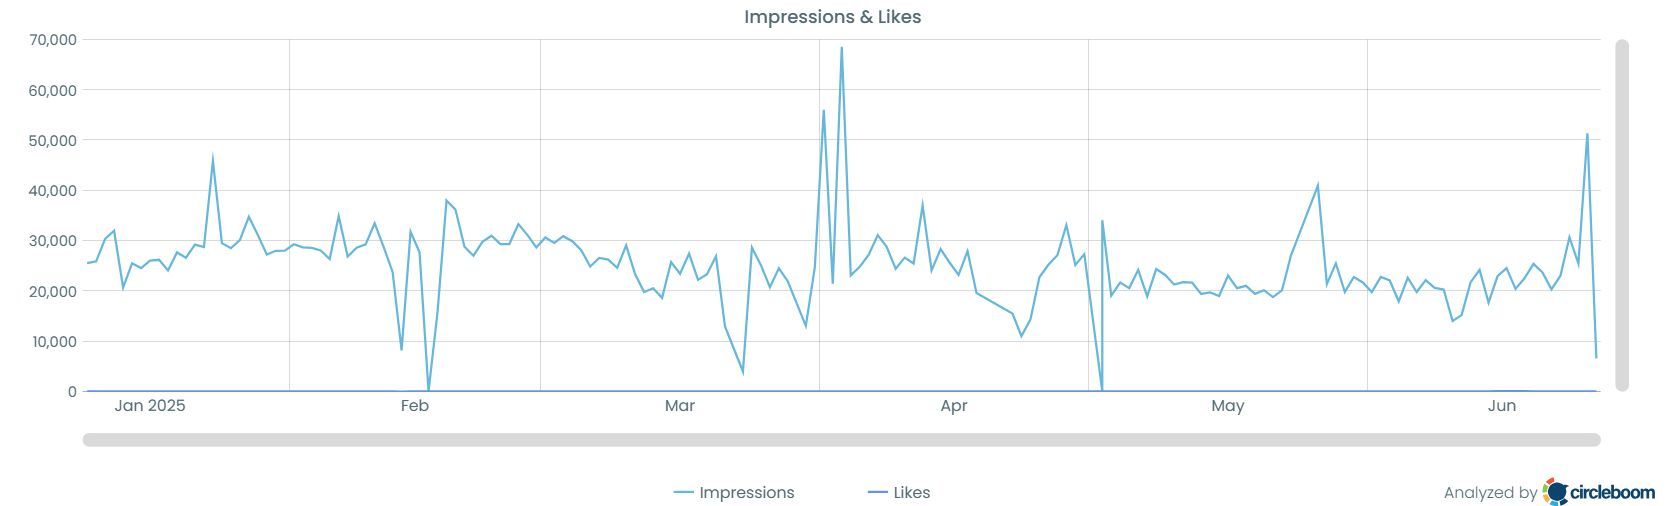
There, you can get line and bar charts for your Twitter performance metrics. You can track content performance on graphs for selected time periods.
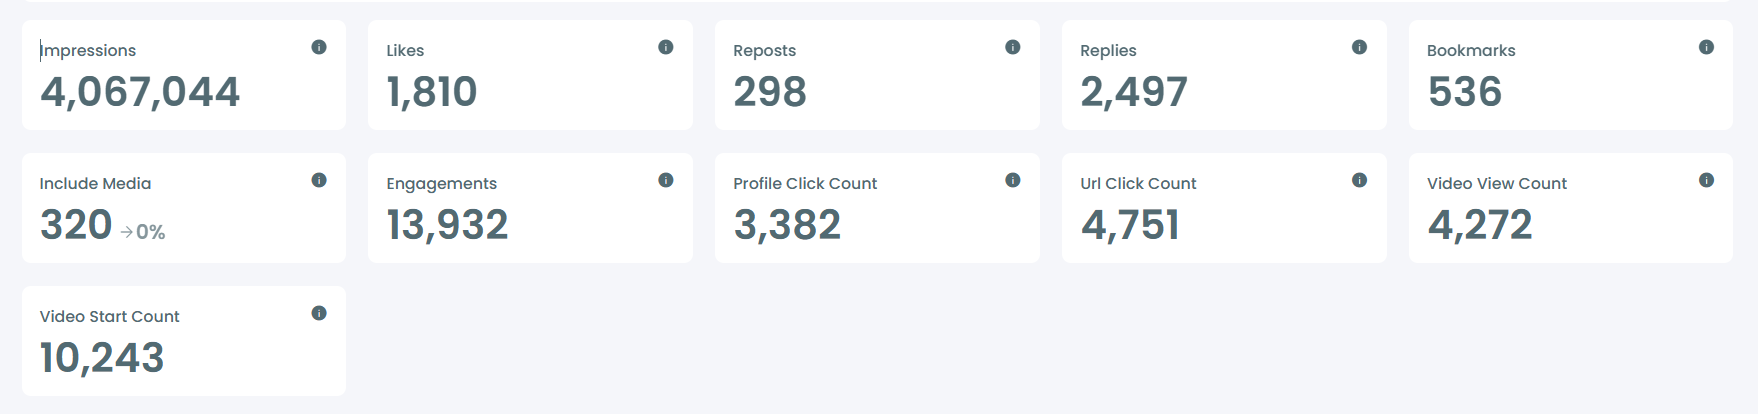
You also have numerical data for each metric, such as impressions, likes, and video view count.
3
03
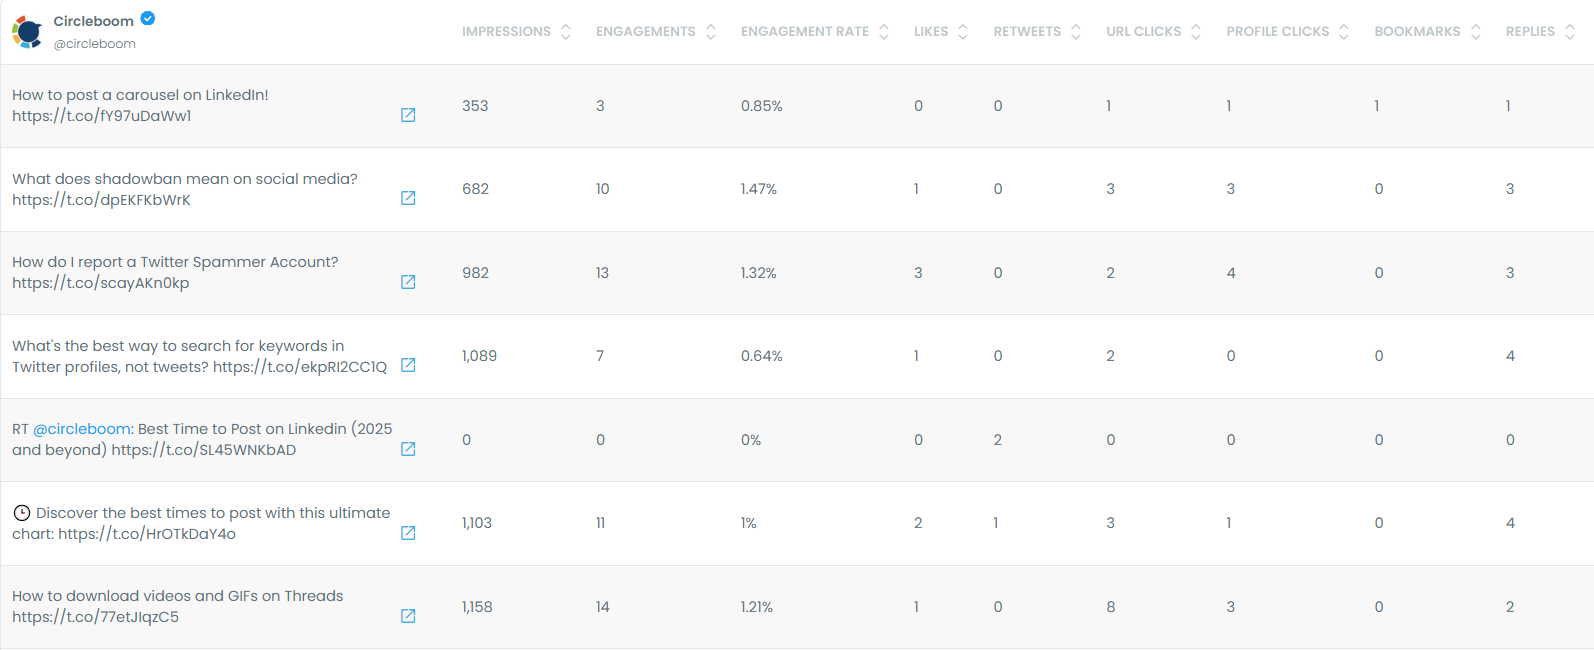
Now it's time to check “Post Engagement Analytics”.
Here you will see Twitter performance metrics for each tweet. You can sort tweets by impressions, engagement, etc.
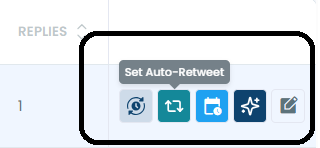
What makes Circleboom great here is the action options for your successful tweets. You can reschedule, rewrite with AI and auto-retweet your most liked, retweeted, clicked, etc. tweets and expand your reach on Twitter.
4
04
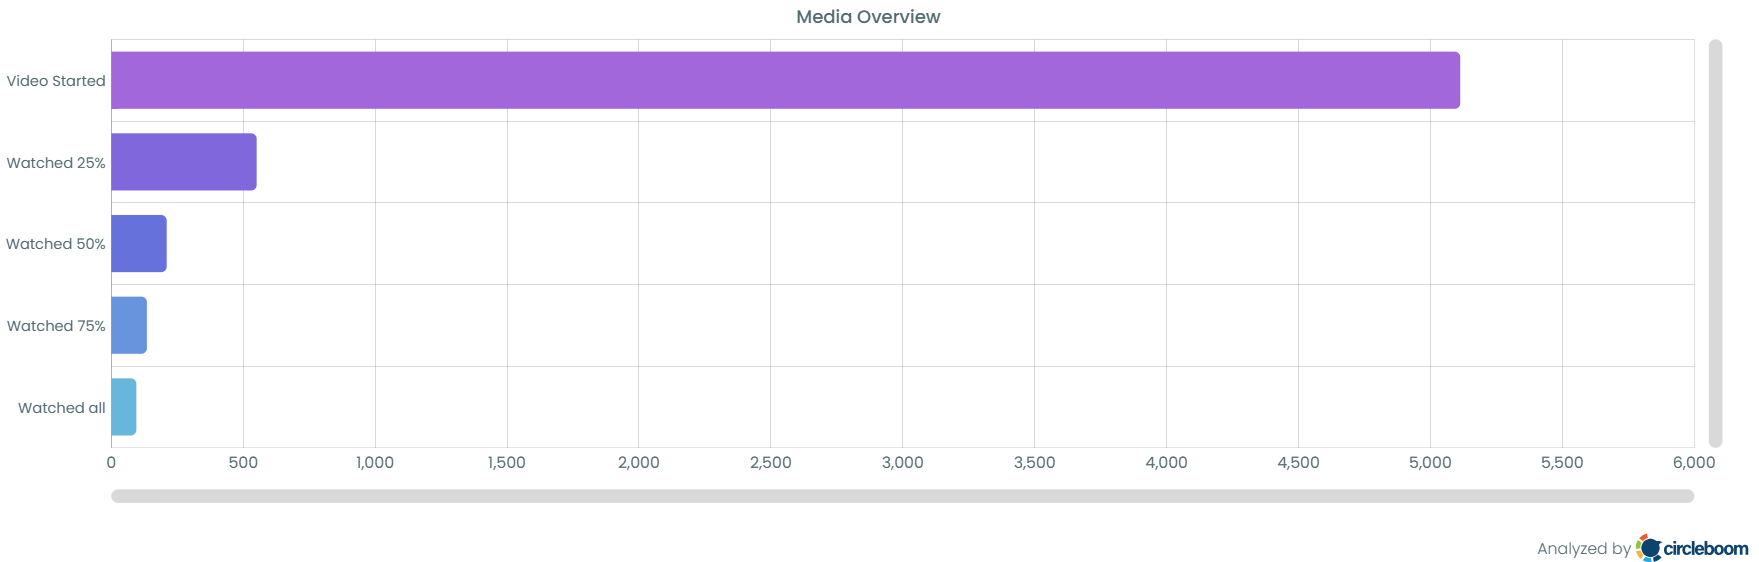
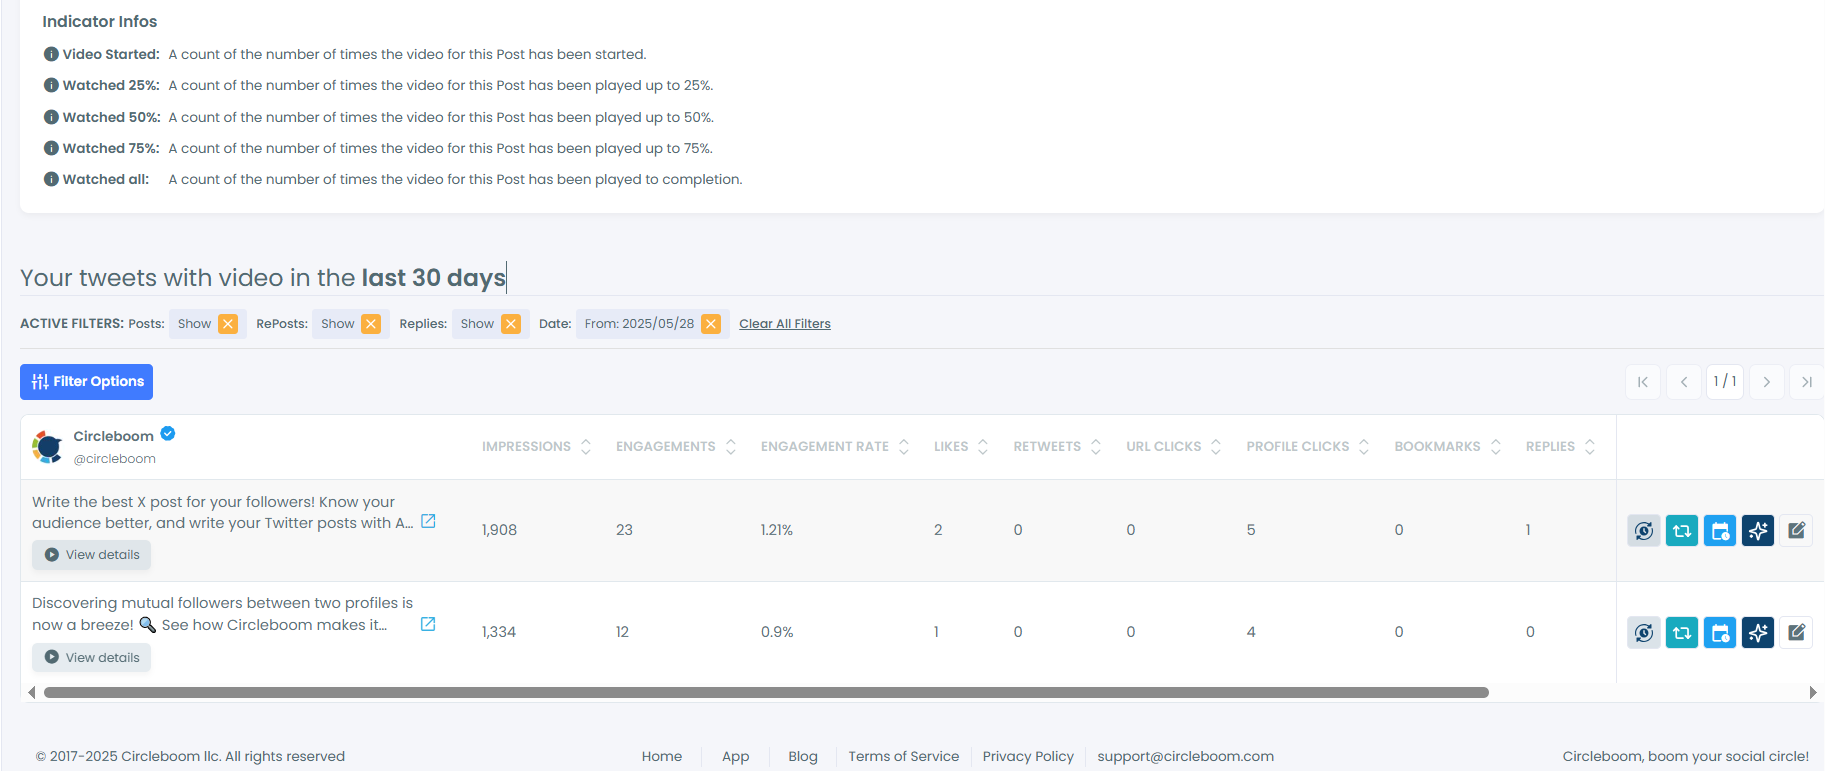
Last but not least, let us check “Video Analytics”.
You will have a detailed analysis of your video views. How many people started your video, how many people watched 25% of a video you shared, how many people watched 50% of a video you shared, or how many people watched all of the video you posted!
Also, you will get a detailed analysis of each video you shared on X.
[1] Everyone deserves to use good products. That's why we're committed to ensuring our platform remains cutting-edge and meets your needs through ongoing enhancements.