
On Twitter, an impression is counted every single time your post loads on someone's screen. That is the whole definition. It does not mean someone read your post, liked it, or even paused on it. If your tweet scrolled past a person's feed and rendered on their display, that counts as one impression, whether they engaged or ignored it completely.
This is why what does impressions mean on Twitter trips up so many people. The number looks like an audience count, but it is really a display count. The same person can generate several impressions on the same tweet by seeing it more than once.
On Twitter, an impression is every time your post appears on a screen, including passive scroll-pasts, so it counts views, not readers or unique people. Circleboom's Impression Analytics pulls this data through official, sanctioned API access and charts your impressions as a visual trend over any period from 7 days to a full year. Read the pattern, not a single day's spike.
→ what does impressions mean on Twitter
Below: how impressions differ from reach, engagement, and profile views, and where to read yours as a trend.
Most explanations stop at "impressions are how many times your tweet was seen." That definition is technically fine and practically useless, because it leaves the reader thinking impressions equal people. They do not. The gap this article closes is the difference between a raw display count and the metrics that actually tell you something about your audience.
Once you understand what the number counts and what it does not, you stop chasing a vanity figure and start reading the trend behind it.
Impressions vs Reach vs Engagement vs Profile Views
Four metrics get confused constantly, and each one answers a different question. Getting them straight is the fastest way to stop misreading your own analytics.
- Impressions count total appearances on screens. One tweet seen three times by the same person is three impressions.
- Reach counts unique viewers. That same tweet seen three times by one person is one reach. Reach is always lower than or equal to impressions.
- Engagement counts actions taken, likes, replies, reposts, bookmarks, link clicks. This is the effort metric, and it is far smaller than either impressions or reach.
- Profile views count how many people clicked through to your profile page, a separate action from seeing your post in a feed.
Impressions tell you exposure. Engagement tells you response. The gap between them is your real signal.
A tweet with 50,000 impressions and 12 likes did not fail to get seen. It got seen and skipped. That is a content or relevance problem, not a distribution problem, and only the two numbers side by side reveal it. Twitter's own help documentation on account analytics treats impressions and engagements as separate columns for exactly this reason.
One more distinction worth nailing down. Impressions are not "who viewed my profile." Twitter does not show you a list of the specific people who saw a given tweet, and it does not tell you which individuals looked at your profile. Anyone promising a named list of viewers is either guessing or scraping. For the reasons behind a sudden change in the number, this look at why my Twitter impressions suddenly dropped walks through the common causes.
Why the Impression Number Is Almost Always Inflated
Impressions are inflated by design, and knowing how keeps you from over-celebrating a big number. Every passive scroll-past counts. So does every time the same follower reloads their timeline and your tweet renders again.
If a loyal follower opens the app four times in a day and your pinned tweet loads each time, that is four impressions from one human who has already read it. Multiply that across an active audience and the raw impression figure balloons well past the number of actual people reached.
This is not a flaw to fix. It is simply what the metric measures. The practical takeaway is that impressions are a directional signal, not a headcount. A tweet doubling its usual impressions tells you the algorithm pushed it wider than normal. It does not tell you twice as many unique people care. For the deeper question of whether specific interactions register, this breakdown of whether likes count as impressions on Twitter clears up a common point of confusion.
Circleboom reads this data as a company that uses official X (Twitter) Enterprise APIs, so the impression counts you see are the full, sanctioned figures X reports. They are not partial estimates stitched together by a scraping tool. When the topic is data accuracy, that distinction matters, because incomplete data leads to wrong conclusions about what is working.
Where to Read Your Twitter Impressions Over Time
Circleboom's Impression Analytics turns the raw impression number into a trend line you can actually interpret. Instead of checking a single tweet's count, you see how impressions move across a chosen window, so a one-day spike stops looking like a pattern and a slow monthly decline finally becomes visible.
Circleboom aggregates your per-tweet impressions by day and charts them alongside a second metric of your choice, so you can watch impressions and engagements rise or fall together. This works without an X Premium subscription, which is where the native platform gates most of this view. If you want to confirm the native limits first, this guide on how to check analytics on Twitter without Premium covers what you can and cannot see for free.
Here's the flow, in order. It runs in four quick steps, from connecting your account to reading the trend.
Connect your X account to Circleboom
- Log in to Circleboom Twitter and connect your X account with official OAuth.

Open the analytics dashboard
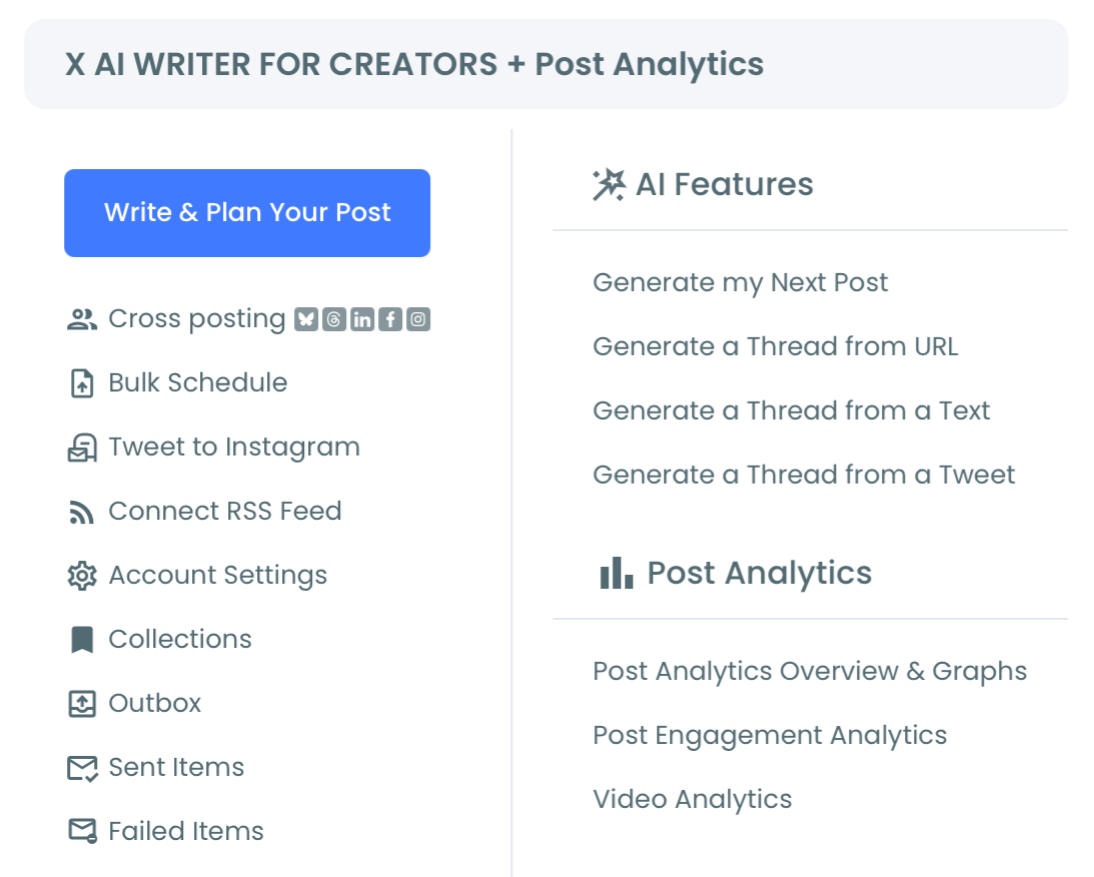
- Open the X Post Planner menu and go to the Post Analytics section where the overview graphs and metric cards live.
- Select a time range. Choose a preset (7D, 2W, 4W, 3M, 1Y) or open the calendar for a custom window. Longer ranges give steadier trend signals; a 7-day view swings hard on a single viral post.
Read the impression trend, not a single spike
- Set Impressions as one chart metric and pair it with Engagements. Read the two lines together, then check the summary cards below for total impressions and the percentage change versus the previous equal period.
That order works because it front-loads context before conclusions. You connect once, frame the right time window, then read impressions against engagement so the number carries meaning instead of standing alone. Skip the pairing step and you are back to staring at a display count with nothing to compare it against.
At a glance: connect, open Post Analytics, set the time range, chart Impressions against Engagements.
See it live: how a raw impression count turns into a readable trend line paired with engagement in one Circleboom view.
Unlike squinting at one tweet's number in the native app, Circleboom's impression tracking over time shows you direction, which is the only thing the impression metric is actually good for.
What the Trend View Actually Tells You
A single impression count answers almost nothing. The trend answers the questions that change what you post next. Whether your reach is growing, flat, or shrinking. Which weeks broke the pattern. Whether a strategy change moved the needle or just felt like it did.
Pair the impression line with the engagement line and the picture sharpens further. Impressions climbing while engagement stays flat means you are being distributed wider but connecting less, often a sign the algorithm is testing your content with a colder audience. Both lines rising together is the healthy pattern. To go deeper on the numbers behind the chart, this complete guide to Twitter analytics metrics breaks down what each figure actually measures.
The deeper insight most people miss: impressions are the least actionable number on your dashboard on their own, and the most useful one in context. Alone, they measure exposure you cannot control. Paired and tracked over time, they become the earliest warning system you have for a shift in how X is treating your account.
The Bottom Line
An impression on Twitter is one thing and one thing only: your post loaded on a screen. It is not a reader, not a unique person, not a profile visit, and it is inflated by every scroll-past and repeat view. Treat the raw number as a rough exposure signal, then read the trend to learn anything real.
That read is exactly what Circleboom's Impression Analytics is built for, charting your impressions over any window and pairing them with engagement so the number finally means something. When you're ready, open your Impression Analytics dashboard and watch the trend instead of the tally.
→ Track what impressions mean for your account with Circleboom
Common Questions About Twitter Impressions
Does an impression mean someone read my tweet?
No. An impression only means your tweet loaded on a screen, including a passive scroll-past where the reader never stopped. It measures exposure, not attention or reading. To know whether people actually engaged, compare impressions against engagement actions like replies, likes, and clicks.
Why are my impressions so much higher than my follower count?
Impressions count every appearance on a screen, so one person seeing your tweet several times generates several impressions, and non-followers reached through reposts or the algorithm add more. A tweet can easily rack up more impressions than you have followers without reaching that many unique people. Reach, not impressions, is the metric closest to unique viewers.
Can I see exactly who viewed my tweet or profile?
No. Twitter does not provide a list of the specific individuals who saw a tweet, and impressions are an aggregate count, not a viewer roster. Any tool claiming to show named viewers is either guessing or pulling data through unauthorized methods. Circleboom reports the real aggregate impression figures through official API access, not fabricated viewer lists.