
Take two competitors in the same month. One collects 300 replies across 300 posts, and the other collects 120 replies across 30 posts.
The first account wins on volume and the second wins per post, four to one. Which of them is ahead of you depends on which number you read, and this guide shows how to get both for your own average replies per tweet comparison.
By hand: counts taken in different weeks from different numbers of posts, with no way to say how each figure was obtained. Circleboom: compares replies per post for up to five accounts on X in one dated report built on data from official X (Twitter) Enterprise APIs.
→ average replies per tweet
The steps come first, then the rule for which reply number to quote.
Why one reply number is not enough on Twitter
A single reply figure hides whether an account earns conversation post by post or simply posts a lot. You need a per-post average and a period total, for you and for each competitor, taken on the same date.
Replies are scored on their own in X's ranking code
Replies get this much attention for a reason. X's open-source ranking code describes a model that predicts separate probabilities for a like, a repost and a reply, then combines them in a weighted sum.
The heavy ranker README in that repository lists the weights as they stood in April 2023.
A predicted reply carried a weight of 13.5, against 0.5 for a like.
The same file says the weights can be adjusted at any time, so read them as a sign that replies are scored as their own signal and not as today's exact values.
A profile page does not help much here. It shows follower and following counts and the engagement visible on recent posts, and it shows no per-post average for anything.
The mistake I see most often is a team quoting a rival's busiest thread as if it were the rival's normal. One thread is an anecdote. A column of per-post averages for five accounts is a comparison.
Circleboom reads the reply counts of every X account in a comparison from the same official records and lays them out side by side. That is how you get your average number of replies on a tweet and a competitor's on one basis.
Which competitor accounts to compare on X first
Choose direct peers before you open the report, because the accounts you pick define what a good reply average means. A direct peer shares your market, language, account scale and reason for publishing.
Have these in hand before the first step:
- Up to four competitor handles, plus your own. The report holds five accounts in total.
- Public accounts only. A private account cannot be analyzed.
- No account above 3,000,000 followers. The report cannot analyze accounts over that size.
- A note of which accounts are direct peers and which are category leaders you only want to study.
Direct peers and category leaders are different lists
Keep that last distinction visible. Sharing a sector is not enough to make two accounts peers. A regional support account and a global brand account that leads with entertainment can sit in the same industry and serve different goals.
A category leader's raw totals are useful for studying an approach and misleading as a target for a smaller account.
Where to look when you are short of names
If you do not have four names yet, Circleboom has a search built to find influencers on Twitter by niche.
Starting from a topic with no list of rivals yet? A step-by-step article shows how to find Twitter influencers for free.
Keyword search demo: finding the influential accounts in a Twitter niche, which is how a list of competitors to compare usually starts.
Once the set is chosen, keep it stable. If you swap an account between two runs, say so in your report, because a different group is not a change in your position.
How to compare your average replies per tweet with competitors on X
The process has three phases: name the accounts, start the run, then read replies in three places.
Open the report and name the accounts
- Open Circleboom Twitter Management and connect your X account.

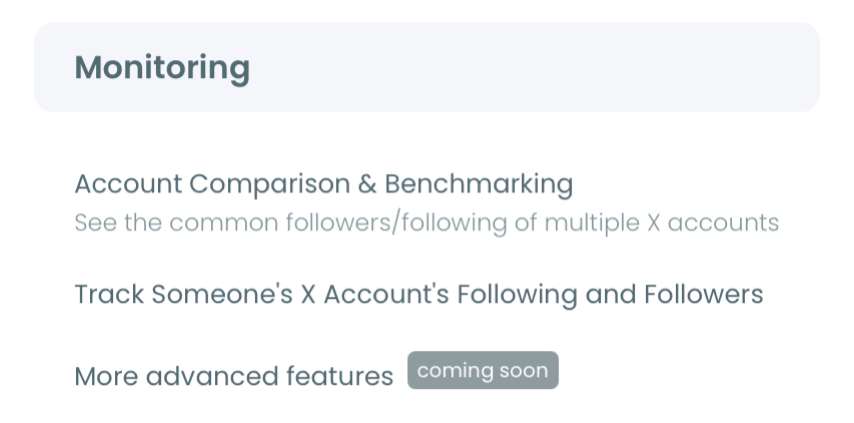
- Go to the Monitoring menu and select X Competitor Benchmark Report, the first item, which carries a New label.
- Enter your own handle and your competitors' handles under Account Handles. Use the + button to add a slot, and watch the counter that reads how many of the five are filled.
Start the run and decide whether it repeats
- Click Start Competitor Analysis. The note under the button says reports are unlimited and that the run pulls new data from X.
- Choose Just this once or Keep it up to date every month. The monthly option produces today's report and then one each month. Competitor Tokens are charged per competitor per report, and your own account is never charged.
Read replies in three places
- Open the finished run with View report and scroll to the Engagement section. In the Engagement summary table, find the AVG REPLIES column and read your row against each competitor's row.
- Select the Replies tab on the over-time chart below the table. It plots total replies for each account month by month.
- Go to Content Leaderboards and open Top 5 Tweets by Replies. Each account's five most-replied posts are listed in side-by-side columns.
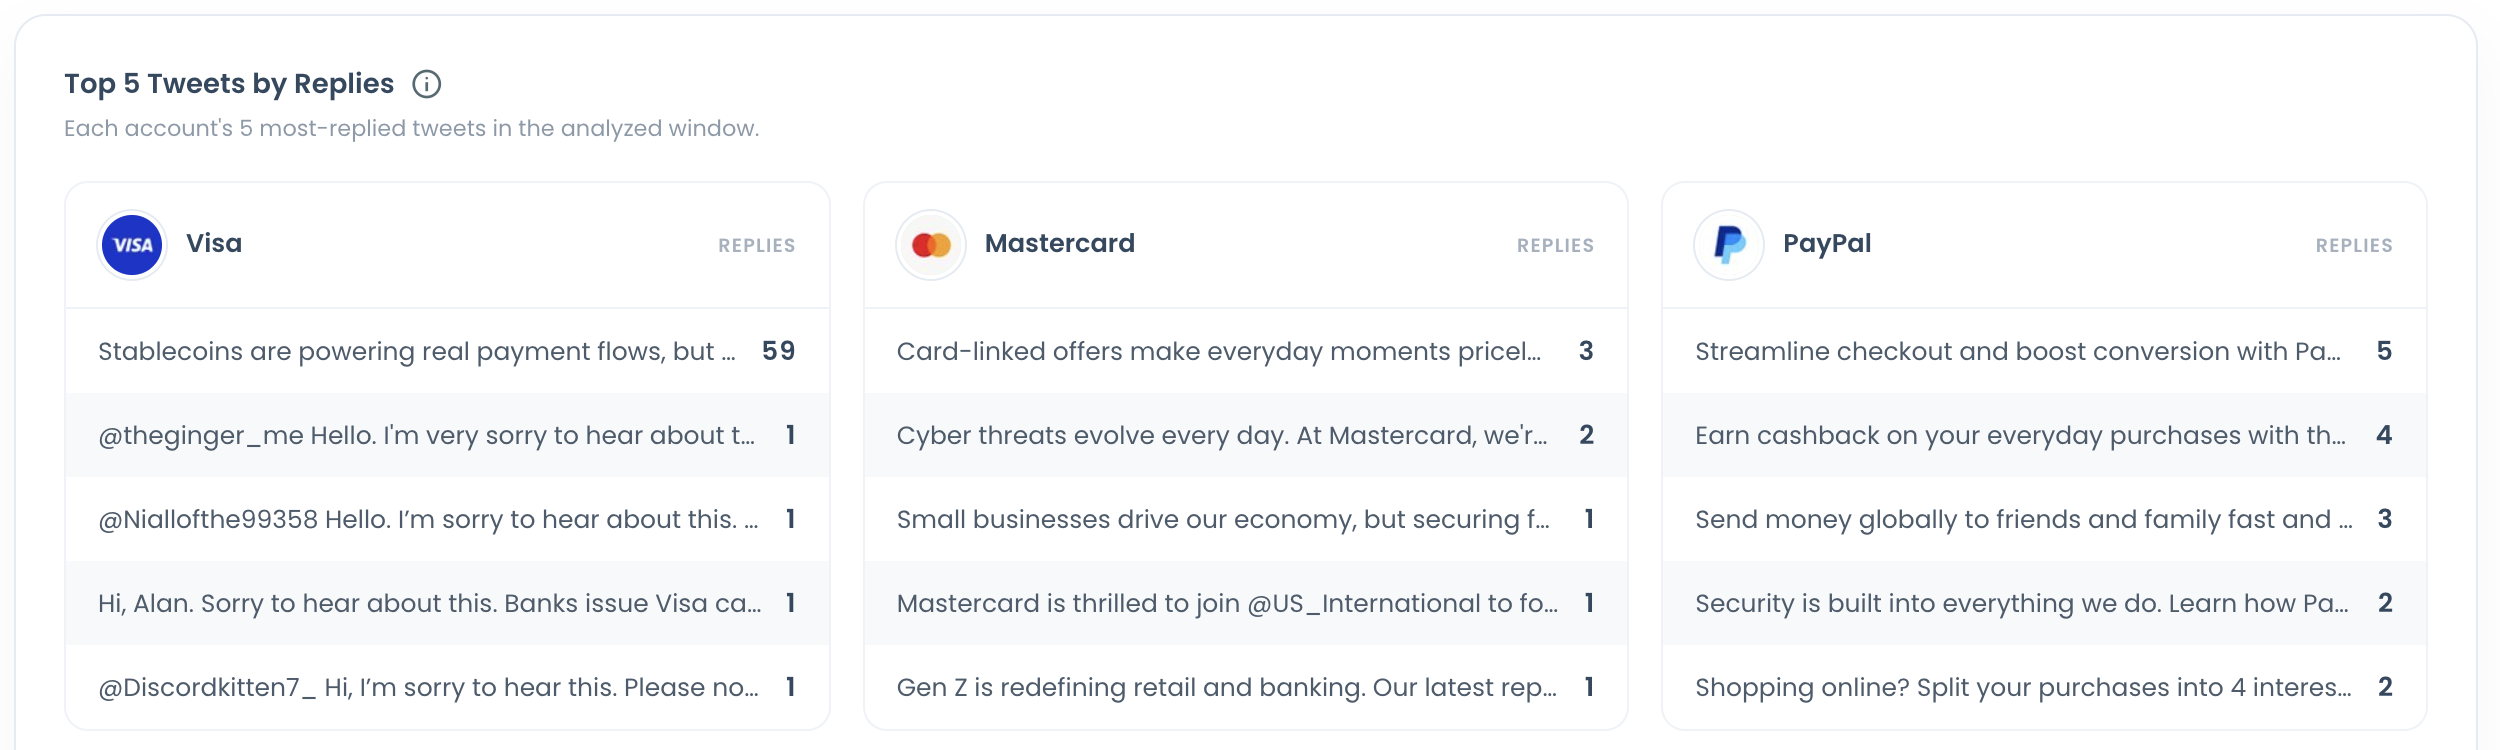
Reading in that sequence keeps each number in its place. The table gives a figure that is fair across accounts of different output, the chart shows when the replies arrived, and the leaderboard names the posts behind both.
The run in three lines:
- Pick up to four public competitor accounts and add your own.
- Start the analysis once, or put it on a monthly schedule.
- Read AVG REPLIES, then the Replies tab, then Top 5 Tweets by Replies.
Per-post average or monthly total: which reply number to quote on Twitter
Quote the per-post average when the question is whose posts draw more conversation, and quote the monthly total when the question is how much conversation an account collected. The two numbers come from different parts of the report and they can disagree.
The AVG REPLIES column is the report's average replies per tweet figure. Every interaction column in the Engagement summary table is a per-post average, and period totals appear only in the over-time charts.
A competitor can lead the Replies chart and trail in the AVG REPLIES column, or the reverse.
The opening example shows how. An account with 300 replies from 300 posts averages 1 reply per post. An account with 120 replies from 30 posts averages 4. The first has the taller bar and the second has the stronger post.
| The question you were asked | Number to quote | Where it is in the report |
|---|---|---|
| Do their posts start more conversation than ours? | AVG REPLIES, per post | Engagement summary table |
| How much conversation did they collect last month? | Total replies for that month | Over-time chart, Replies tab |
| Which posts did it? | The posts themselves | Top 5 Tweets by Replies |
| Did something change between two runs? | Per-post average first, then totals | The same sections in two dated runs |
What a gap in only one number tells you
A competitor ahead on monthly totals but level with you per post is ahead on volume. Closing that gap means publishing more, and it does not mean your posts are weaker.
A competitor ahead per post but behind on totals publishes less and lands more. That gap is about content, and it costs something different to close.
The same rule applies to a monthly or quarterly review. A change worth reporting is one that shows in the per-post averages and not only in the monthly totals, because totals move with the number of posts.
When you write the finding down, state the basis next to the figure. "4 replies per post across the analyzed sample" and "120 replies in one month" are both true of the same account and tell different stories.
Go from the number to the posts
Neither number says what people wrote. Top 5 Tweets by Replies is where the comparison turns into something you can read.
Open the listed posts and read the replies under them. A tall month in the Replies chart is sometimes a wave of criticism rather than approval. That situation has its own article: how top brands use X for crisis management.
One more check keeps the average honest. The sample is up to about 3,200 of each account's most recent posts, so a frequent publisher's average covers a shorter period than an occasional publisher's.
What gets people to reply to a post on X?
A post that asks the reader for something gets replies: a clear question at the end, or a poll. That is the pattern to look for in your competitors' most-replied lists before you change anything of your own.
Start with the evidence in the report. If the posts in a competitor's Top 5 Tweets by Replies ask for opinions, an open question or a poll on the same theme invites the same kind of participation from your audience.
The report's Content Type & Format section adds one useful fact. Its post format mix shows the share of each account's posts that are polls, so you can see whether a competitor with a high reply average is also a heavy poll user.
Two changes to test on your own posts
Two changes are worth testing first:
- Close a post with a single direct question.
- Run a poll on a theme that drew replies for a competitor.
For the second, the Poll Generator sits inside Circleboom's X Post Planner, and scheduling Twitter polls queues each one for a set day and hour.
Timing has its own article, on how the timing of your Twitter poll affects participation.
Check one setting before you judge the result. X's help page on conversations on X covers who can reply to a post. A post that limits replies will show a low count for reasons that have nothing to do with the content.
After a month of changes, read the next dated run. Compare your per-post average with the previous run first, and remember that a re-run refreshes a rolling sample of posts.
Which Twitter reply gap you have decides the next move
The comparison ends in one of three situations, and each has a different next step. In my experience the third is the one teams overlook.
- If you trail on monthly totals but match the per-post average: the gap is output. Plan a steadier posting schedule before you rewrite anything.
- If you trail on the per-post average: the gap is content. Study the competitor's five most-replied posts and test questions and polls.
- If the leading account posts mostly replies to customers: it is a support account. Keep it as context and compare yourself with the publishers in the set.
The reason this holds up in front of a manager is the source. Circleboom is a verified Enterprise partner of X, so every reply count in the report traces back to X's own records. Each run also carries a date and a named set of accounts.
Run it once to get the baseline, and the next run will tell you which way the gap moved.
→ Start your replies-per-tweet average comparison
Replies per post FAQ: edge cases worth checking
Will replying to more people myself raise my AVG REPLIES figure?
Not directly. AVG REPLIES counts replies your posts receive. Replies you send appear in the Original / Reply / RT / Quote distribution. Replying can still bring visitors to your profile on X, and a related article covers whether your followers see when you reply to a tweet. Circleboom can also generate replies with AI.
Are quotes included in the reply average?
No. AVG QUOTES is its own column in the Engagement summary table, next to AVG REPLIES, and Circleboom keeps the two apart for every account on Twitter in the comparison. Quotes also have a separate tab on the over-time chart.
Can the reply comparison refresh itself every month?
Yes. Choose Keep it up to date every month when you start the analysis, then set how many months it should run and the day of the month. Tokens are charged per competitor per report, so five competitors on a 12-month schedule is 13 reports and 65 tokens, and End Scheduling stops it at any time.