
Most advice on X video tells you to beat an average view count. X publishes no such average, and an invented one would not show how your X video views compare with the accounts you compete against.
Your X video views compare fairly with a rival's only as views per video: each account's total video views divided by the number of videos behind that total. Circleboom measures video posting rate and total video views for up to 5 accounts on X through official Enterprise APIs, with a breakdown for each video.
→ Twitter video views benchmark
The table below sorts every video number into what anyone can read and what only the owner can.
A Twitter video views benchmark answers one question: is a rival's video earning more per upload, or is the rival only uploading more? Circleboom's X Competitor Analysis & Benchmark Report reads each account's recent posts on X and shows the video numbers in matching columns, so the question has an answer you can check.
Which X video numbers can you compare, and which stay with the owner?
Three video numbers are visible for any public X account, and two stay with the account owner. Sorting them first saves you from chasing a number that does not exist for the other side.
| Video number | Who can see it | Where to read it |
|---|---|---|
| Video posting rate (share of posts with video) | Anyone, for any public account | Benchmark report, Video Performance section |
| Total video views per account | Anyone, for any public account | Benchmark report, Video Performance section |
| Views on each individual video | Anyone, for any public account | Per-video breakdown in the same section |
| Retention curve (where viewers drop off) | The account owner only | Video Analytics, for your own account |
| Completion (how many watched to the end) | The account owner only | Video Analytics, for your own account |
A fair comparison uses only the numbers that exist for both sides.
Where X itself draws the line on video metrics
X draws the same line in its own documentation. The X API metrics page lists a video's view count as a public metric. The playback counts at 0, 25, 50, 75 and 100 percent sit on the other side, as non-public metrics for your own content.
That page adds a time limit as well. Non-public metrics are available only for posts created within the last 30 days.
The benchmark report respects the split by design. The video retention curve is left out of every column, including your own account's column, so no account shows a blank cell next to a filled one.
A view count also hides the reason a viewer left. Playback trouble is one cause the number can't show, and there is a separate explanation of why Twitter videos keep pausing.
Why total Twitter video views mislead without a posting rate
A total video views figure depends on how many videos an account posted, so it measures output before it measures appeal. Two accounts with the same total can have videos that perform nothing alike.
A worked example with round numbers
Take an illustration with round numbers. A rival shows 150,000 total video views across 30 videos, which is 5,000 views per video. Your account shows 32,000 across 4 videos, which is 8,000 per video.
The rival's total is more than four times yours. Each of your videos still earns 3,000 more views than each of theirs.
A bigger total can come from more uploads alone. Only views per video compares the videos themselves.
Posting rate is what explains the gap between those two readings. If 3 in 10 of a rival's posts include video and 1 in 25 of yours do, the rival's total will be larger even when each of your videos does better.
What a view on X does and doesn't record
The view itself is a defined event, and X sets the rule. Its guide to creating a video views campaign is where X documents how a video view is counted. A view marks that playback began in front of someone, and it says little about how long they stayed.
With no universal figure to aim at, the only meaningful target is a peer's views per video, read on the same basis as yours.
That is why the fair way to measure X video views against rival accounts starts with posting rate and ends with a division.
How Circleboom compares X video views across accounts
Circleboom compares X video views by pulling the same fields for every account in the set on one date. The report holds up to 5 accounts in total: your own plus up to 4 competitors, or up to 5 other accounts without yours.
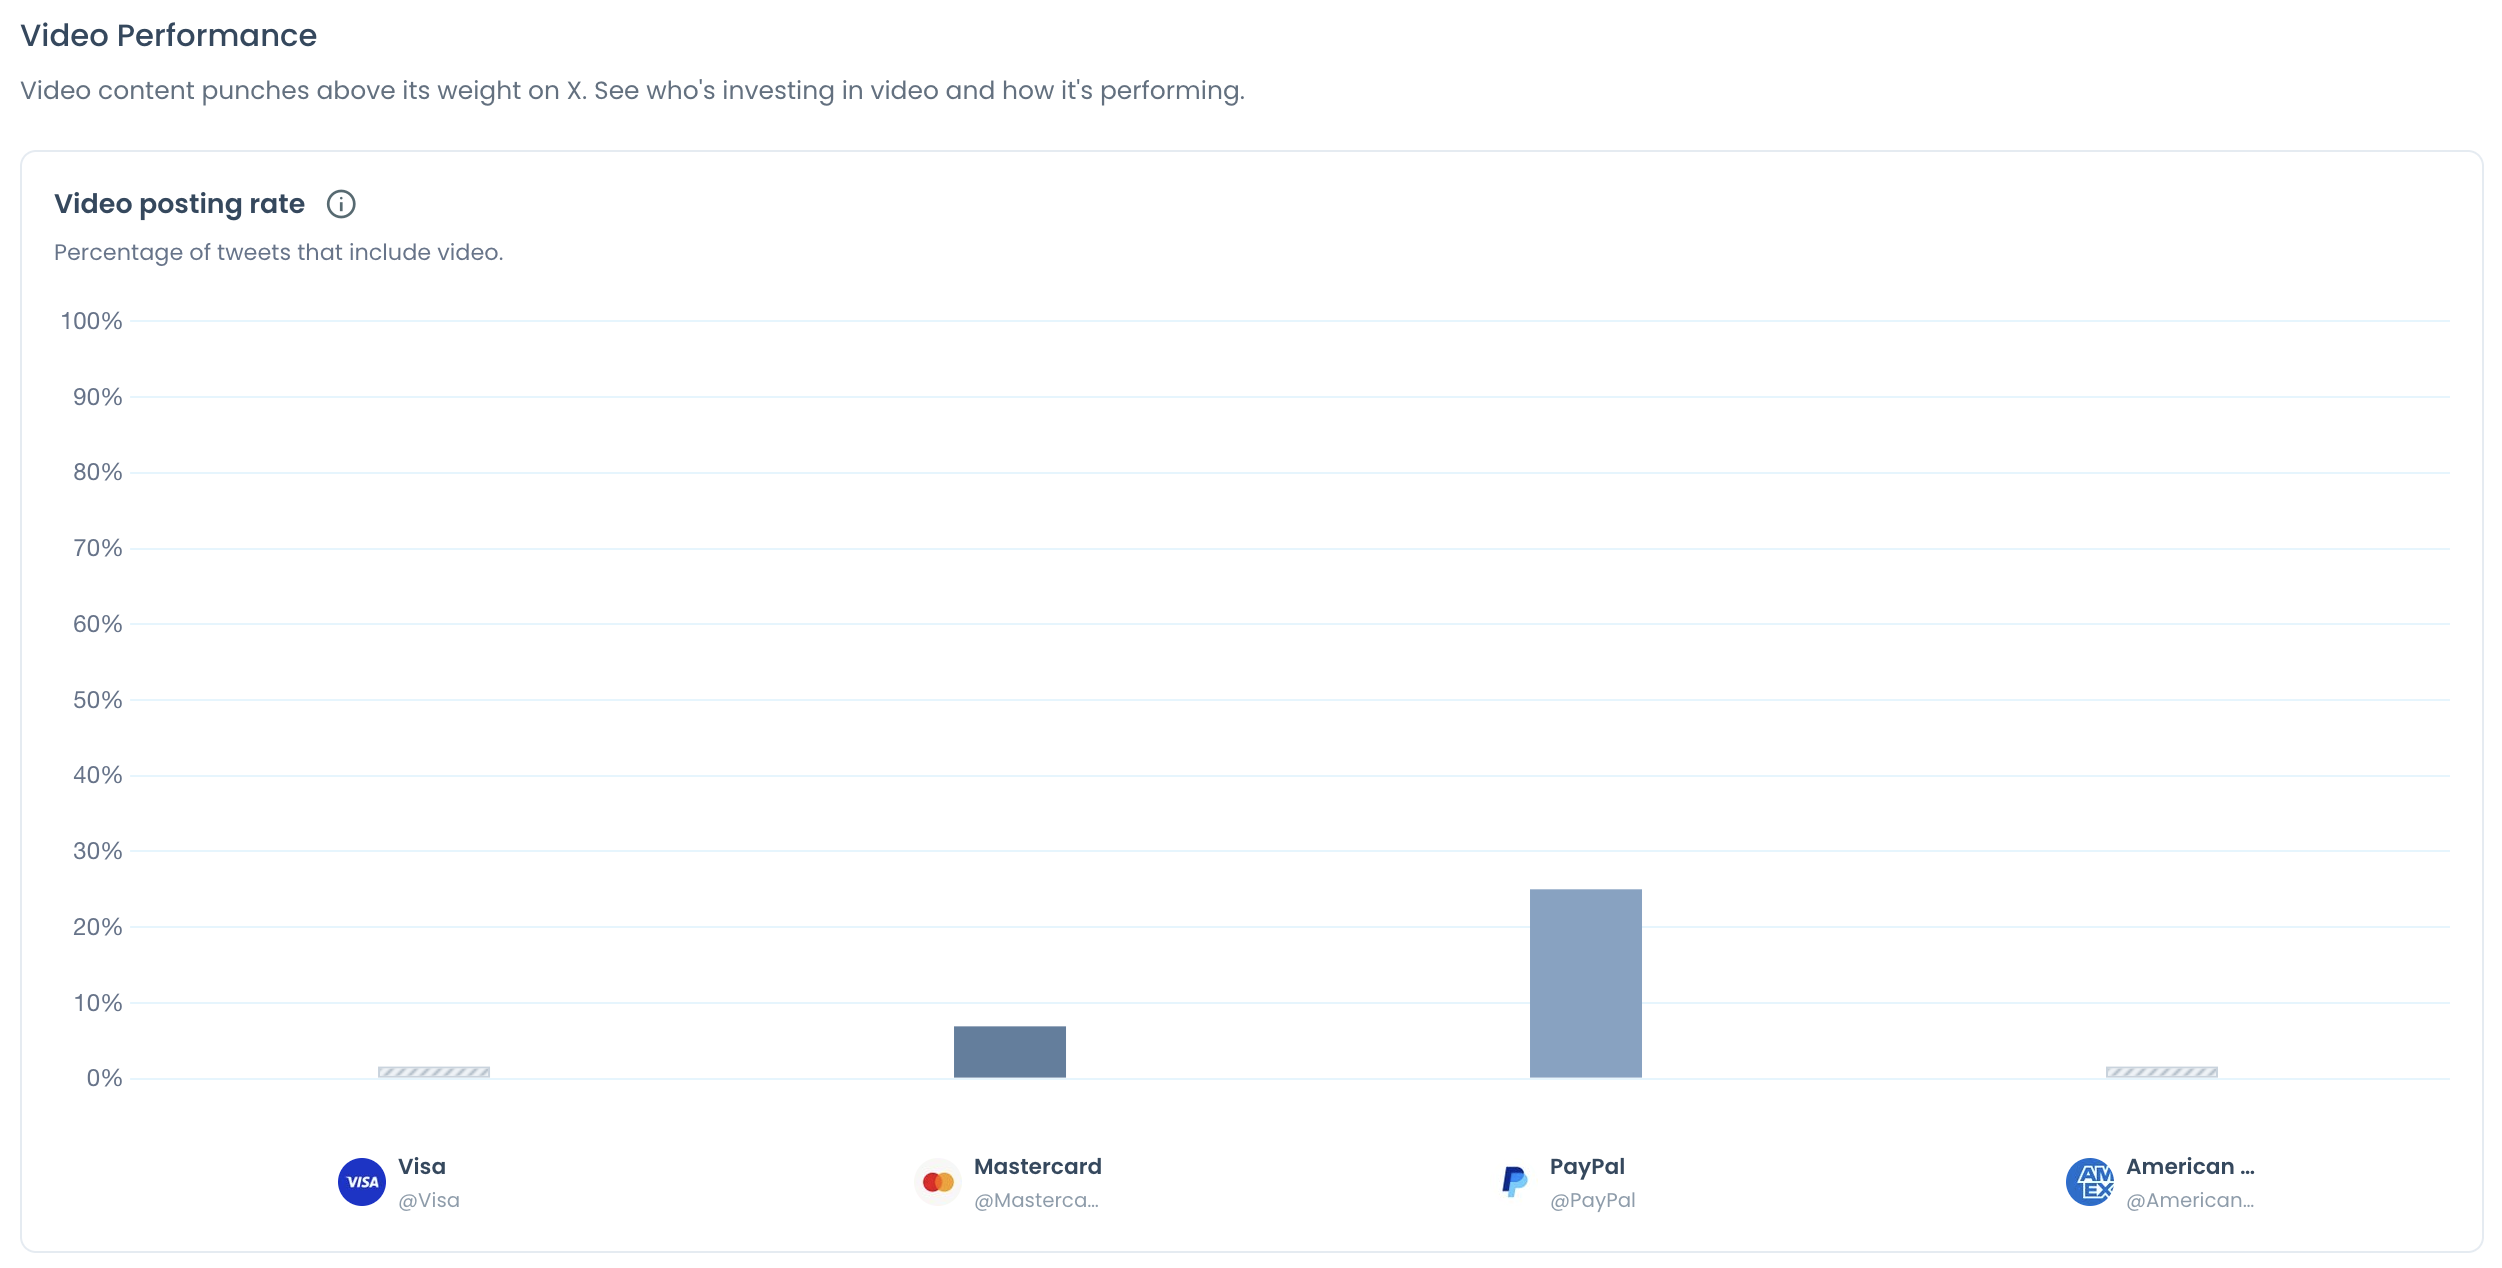
For each account, it retrieves up to about 3,200 recent tweets. The Video Performance section then shows two panels for all accounts in the same order:
- Video posting rate, the percentage of tweets that include video.
- Total video views, with a per-video breakdown over time.
Where the numbers come from
The source matters when someone questions the figures. Circleboom is listed on X's Enterprise customer directory, and every number in the report is calculated from official X API records. Nothing is scraped, so no posts are silently missing from one account's column.
The result is a Twitter video views benchmark that keeps the basis constant across accounts. A hand count can't do that, because each number is gathered at a different moment.
I treat the per-video breakdown as the most useful part of the section. It shows in one look whether an account's views are spread across many videos or concentrated in one or two.
Which accounts belong in the set
Two limits apply before you pick accounts. Only public accounts can be analyzed, and an account with more than 3,000,000 followers can't be added, whether it is yours or a competitor's.
Inside those limits, choose direct peers. An X video views benchmark against a category leader shows how the leader performs, and its totals set a goal a smaller team can't fund. Accounts with a similar audience, publishing purpose and size give you a number you can act on.
Cost follows the size of the set. Each competitor in each report costs one Competitor Token, while your own account is free to include.
Whether video is the right format for your niche at all is a separate check against images and text. The report's Content Type & Format section covers it, and the broader case for why Twitter visuals are vital for Twitter marketing is a useful companion read.
What an empty video panel means for a rival's X account
An empty video panel means the analysed sample holds no video. It does not mean the account has never published one.
The reason is the sample window. The report reads up to about 3,200 recent tweets per account, and that number of posts covers a shorter period for a frequent publisher than for an occasional one.
A rival that posts many times a day can fill the whole sample with recent text posts. Its older videos then fall outside what was analysed.
So confirm that every account in your set has video in the sample before you compare totals. A video views benchmark with one empty column is a comparison of the other columns only.
Treat an empty panel as "no data for this period" and never as a zero to divide by.
Two options follow when one rival comes back empty:
- Compare the remaining accounts and leave that rival out of the video reading.
- Swap in a direct peer that does post video, and say so if you report the result.
Little video activity is also not proof of a missed opportunity. An account may post few videos because its audience responds better to another format.
How to run a Twitter video views benchmark against rival accounts
To benchmark your video views against rivals, put your account and up to 4 competitors into one comparison, then read video posting rate before total video views. Convert each total into views per video by dividing it by the number of videos in the breakdown. The seven steps below run that sequence in two phases.
Set up the comparison set in Circleboom
- Open Circleboom Twitter Management and connect an X account of your own to it.

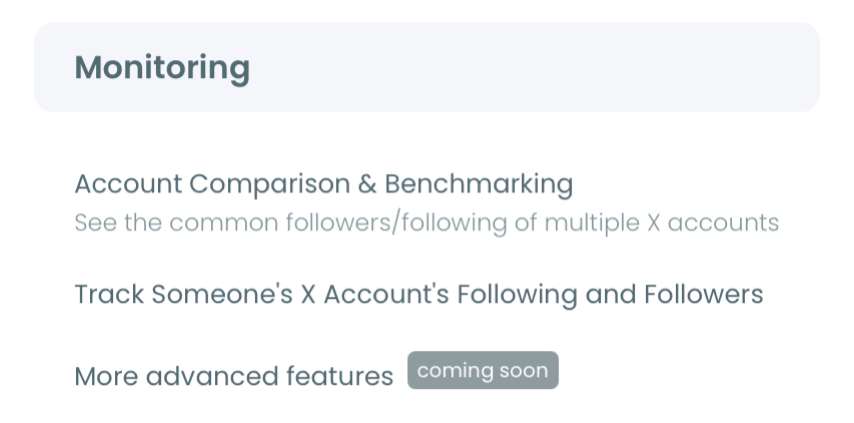
- Go to the Monitoring menu and pick the first item, X Competitor Analysis & Benchmark Report.
- Enter the handles under Account Handles. Add your own account and up to 4 competitors, using the + button for each extra slot.
- Choose how often the report runs, then press Start Competitor Analysis. Just this once gives a single report, and Keep it up to date every month adds an automatic monthly report.
Read the video panels and convert the totals
- Open the Video Performance section and read Video posting rate for every account. This panel shows how much of each account's output is video.
- Read Total video views for each account, then look at the per-video breakdown to see how many videos sit behind the total.
- Divide each total by its number of videos to get views per video, and compare that figure across the set.
The sequence matters for one reason. Posting rate tells you how many videos produced a total, and the total only becomes comparable once it is divided by that count. Read the panels the other way round and a busy account looks like a popular one.
The flow in one line: handles → posting rate → total views → views per video.
What a views-per-video gap on Twitter can and can't tell you
A views-per-video gap tells you that one account's typical video is displayed and started more often than another's. It does not tell you why, and it does not measure attention.
Three readings keep the number honest:
- Check concentration. If one video carries most of an account's views, its typical video is weaker than the average suggests.
- Check the sample dates. Totals from different lengths of time are not the same measurement.
- Check the count. A conclusion that rests on three videos is narrower than one that rests on thirty.
I read a large gap as a prompt to open the rival's strongest videos and look at topic and length. The gap points to where to look. The videos themselves show what to learn.
A gap can also be flat, and that is a finding. If every account in the set lands near the same views per video, the Twitter video views benchmark is telling you that video quality is not where the peers differ.
Posting rate is then the number that separates them.
A re-run needs the same care. Pressing Get a new report with the latest X data refreshes a rolling sample, so a changed figure can reflect new videos, older ones leaving the sample, or extra views on videos that stayed.
Can the same X comparison check a creator before a video brief?
Yes. The comparison slots can hold candidate creators as well as competitors, and Video Performance is the section to read when the brief is video.
Put up to 5 candidates into one run and read the same two panels. A creator's rate card quotes follower count. The report shows how often that creator posts video and what each video earns in views.
The reading rule does not change for creators. Compare views per video, check how many videos the figure rests on, and look for a single clip carrying the total.
Keep the limit in view. These figures describe observed results on a dated sample, and they are input to a partnership review. They do not predict how a sponsored video will perform.
How to get more views on your own Twitter videos after the comparison
After the comparison, the work moves to your own videos: publish more of the kind that earns views, then check how long people watch them. The benchmark shows the gap, and your own analytics show what to change.
Start with distribution. Circleboom has a set of practical ways to get more impressions on Twitter videos, and more impressions is where more views begin.
The rival's own leaders are study material too. The per-video breakdown shows which of their videos earned the most views, so open those and note the topic, the length and the first seconds. Borrow the lesson and keep your own voice.
Measure how long people watch your own X videos
Then measure what the benchmark can't. Circleboom's Twitter Video Analytics shows viewer retention and drop-off for your own video tweets, as a chart of how many viewers start, continue and complete each video.
That retention chart answers the question a view count leaves open. A video with many views and an early drop needs a stronger opening, while a video with fewer views and steady retention needs more distribution.
Nine production tips, on video: how to plan a clip and launch a Twitter video campaign around it.
If the gap you found is posting rate, the fix is a schedule. Queue video ahead in X Post Planner so a higher rate does not depend on uploading by hand every day.
Give the change one full reporting cycle before judging it. With the monthly option on, the next dated report arrives on its own, and earlier runs stay under Past Analyses for a direct comparison.
X video views against rivals: the short version
Your X video views compare with a rival's on three public numbers: video posting rate, total video views and the views on each video. Divide the total by the video count and you have the one figure that is fair to both sides.
Retention and completion stay with each account's owner, so no comparison includes them. For your own videos, they are in Video Analytics.
A Twitter video views benchmark built this way tells you whether video deserves more of your effort before you spend it.
→ Run your X video views benchmark
What people ask before trusting a video views number
Can I see who watched a competitor's video on X, or for how long?
No. Viewer identities are not shown to anyone, and watch-time data for a video belongs to the account that posted it. Circleboom's benchmark report on X covers posting rate and views, and it never claims a competitor's watch time.
Can I turn posts that already perform into short videos for other platforms?
Yes. Circleboom's Tweet to Instagram feature converts a tweet into Instagram content, including a Reel, and you can cross-post videos to several platforms from one place. Audio works too: a recorded conversation is raw material once you turn Twitter Spaces into video clips.
Does switching between followers and following change the video numbers?
No. The toggle switches only the audience sections of the report between an account's followers and the accounts it follows. Video Performance describes each account's own posts on X, so it reads the same in both views.