
How do you calculate average impressions per tweet when X shows impressions post by post and an analytics overview shows them as a period total? You divide the total for a date range by the posts published in that range.
The division is easy; the mistake is taking the total and the post count from two different ranges.
How do you calculate average impressions per tweet on X?
Divide the total impressions for a date range by the number of posts published in that range, then compare the result with your follower count and with the previous range. Circleboom gives you both inputs for your X account, pulling the total and the post list through Enterprise-level access to X's API.
Why the per-tweet average takes two views to calculate
The per-tweet average needs two inputs from the same dates, a total and a count, and no single screen hands you both. X shows each post's views under the post, and a period overview adds them up without dividing the sum by the number of posts.
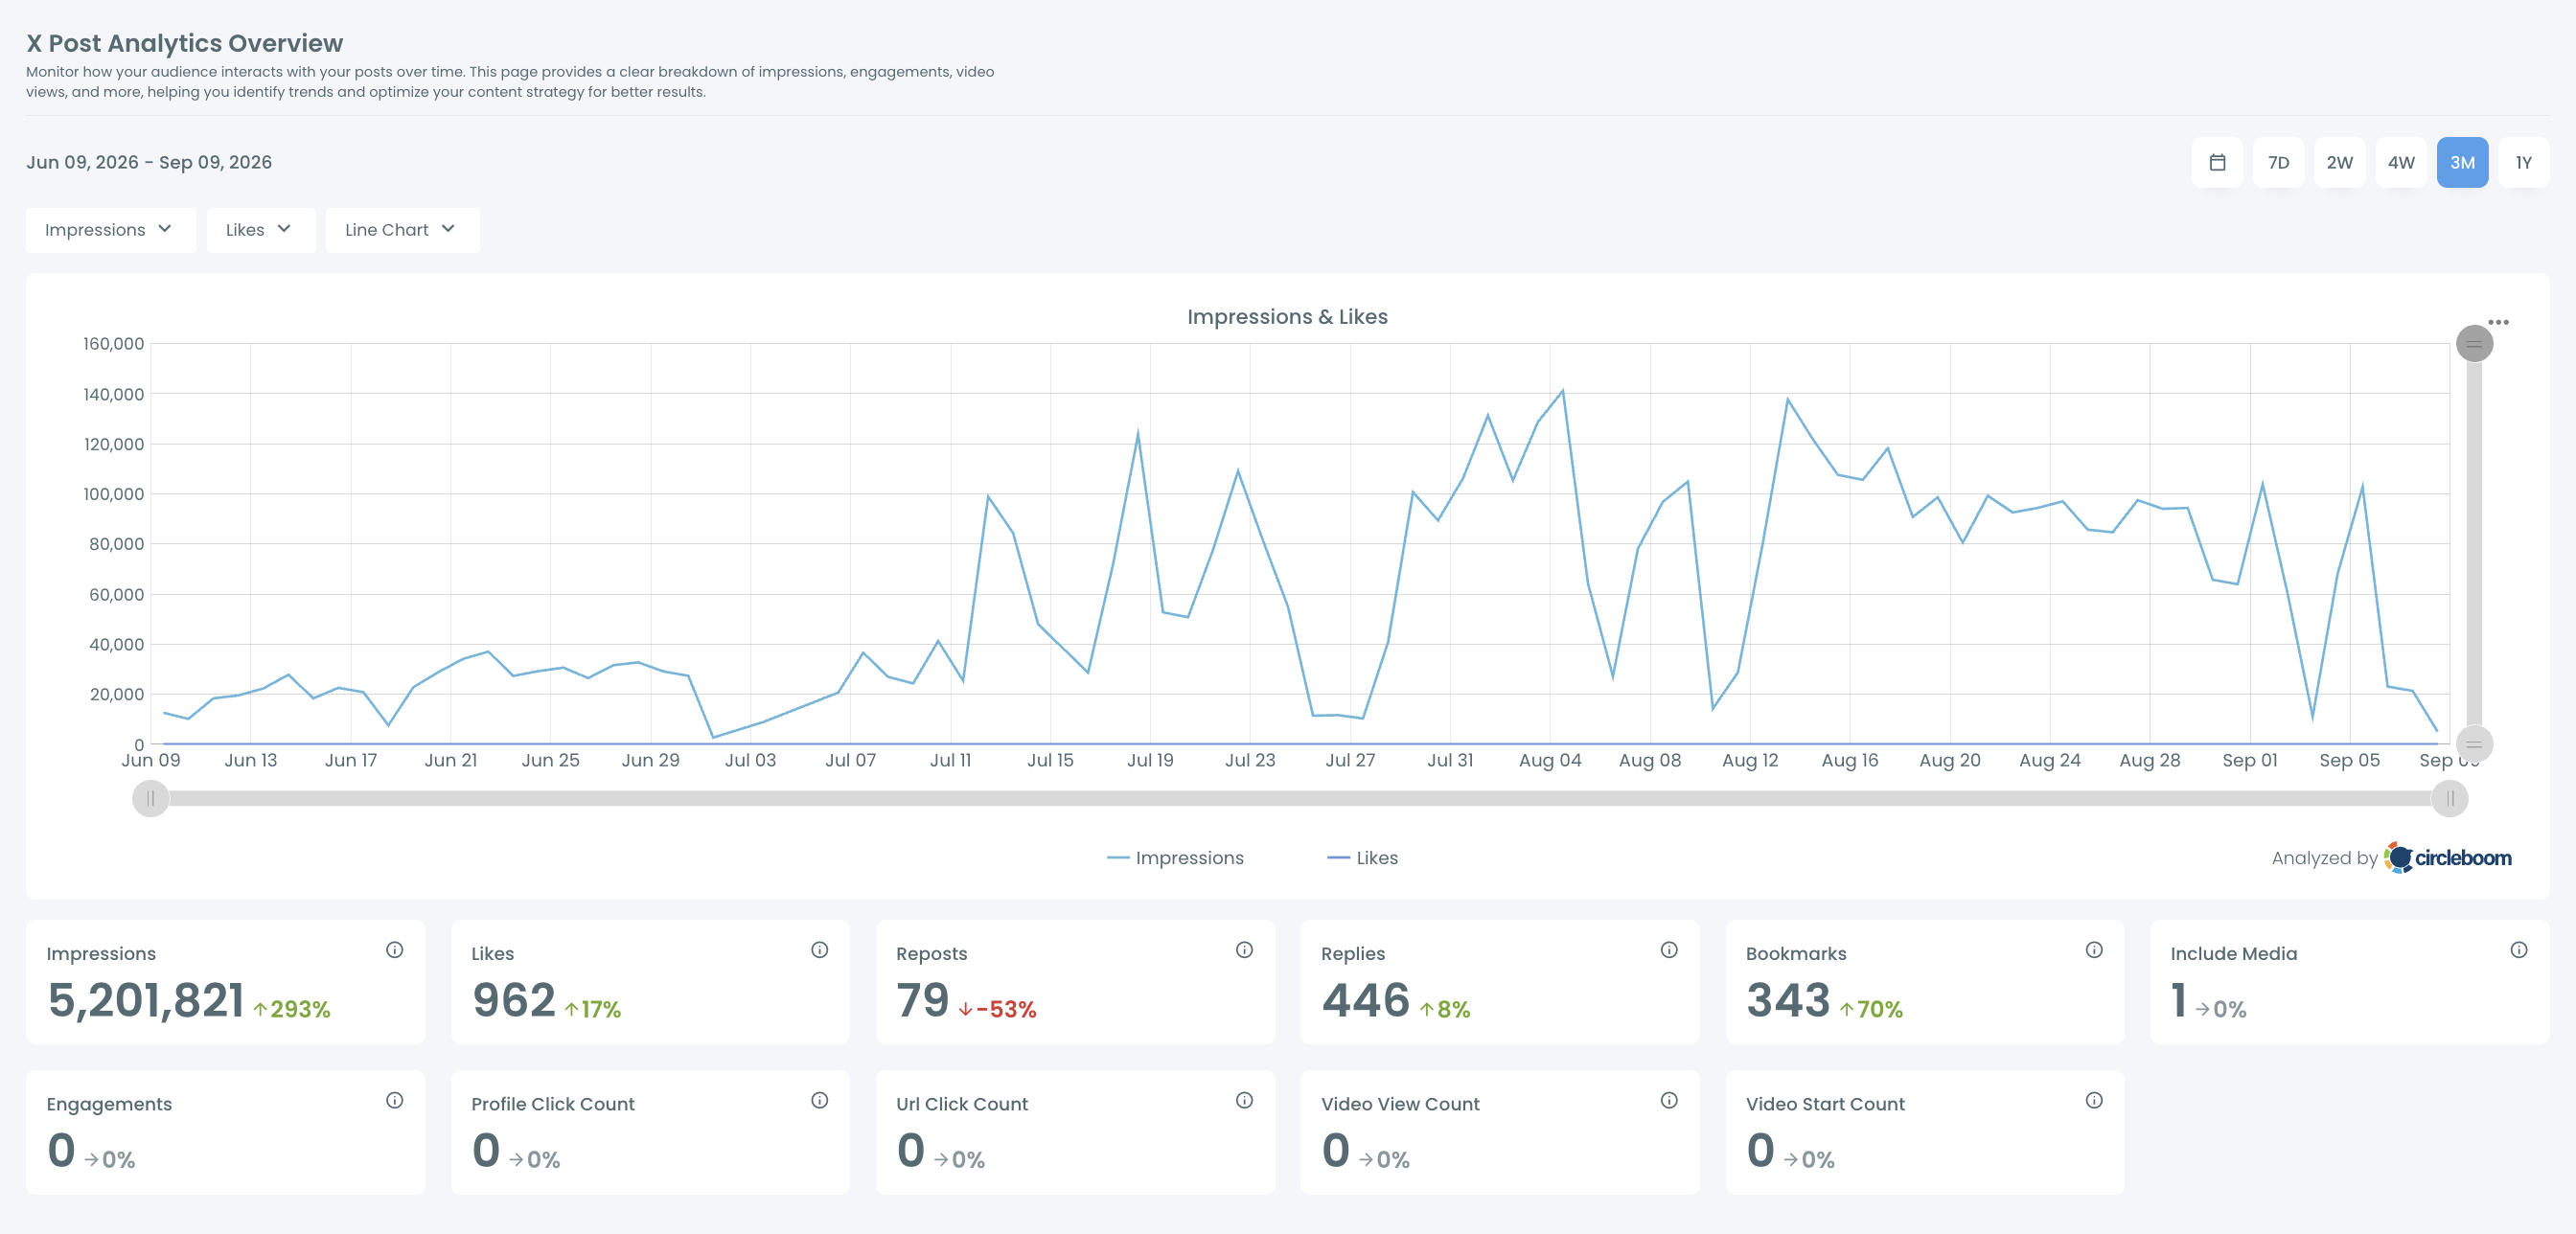
Circleboom's Post Analytics Overview works the same way. Its Impressions card sums the chosen period and reports the change against the period before, but it has no ready-made average-per-post card.
The free metrics calculator does show an average and a median per post. It works from an account's most recent 100 posts, not from a date range, so it cannot line up with a monthly report on its own.
New to where these numbers live? Start with how to see tweet analytics.
I keep the dates identical on both views every time, because a mismatched range is the one error that makes the result look precise while being wrong. A 4-week total divided by a 30-day post count is off by two days of posts before you begin.
The fix is to pull both inputs from one account and one range, at one moment. You can do that with a per-tweet impression average built from Circleboom's two analytics views, as the steps below show.
What each impressions figure on X measures
Impressions count how many times your posts were shown, which is why they grow with every repeat display and every screen a post reaches. The average per tweet turns that running total into a figure you can compare across months and against your follower count.
Three figures often get mixed up:
- Impressions per post: what one tweet collected, shown under it on X as views.
- Total impressions for a period: the sum across every post in the range, shown on Circleboom's Impressions card.
- Average impressions per tweet: the total divided by the number of posts, which you calculate.
For the wider set of numbers that sit next to impressions, see tweet activity metrics.
Once you have your average, set it against 5% of your follower count, the reach share that marks a good post on X. At 6,000 followers, that line sits at 300 impressions per tweet.
What Circleboom gives you for the calculation
Circleboom supplies both inputs of the per-tweet average for your X account: the Impressions total for any period and a filterable list of the posts that produced it.
The Overview is the total side. Its Twitter content performance analysis view offers 7D, 2W, 4W, 3M, and 1Y ranges plus a custom calendar. It charts any two metrics and shows 11 summary cards with period totals.
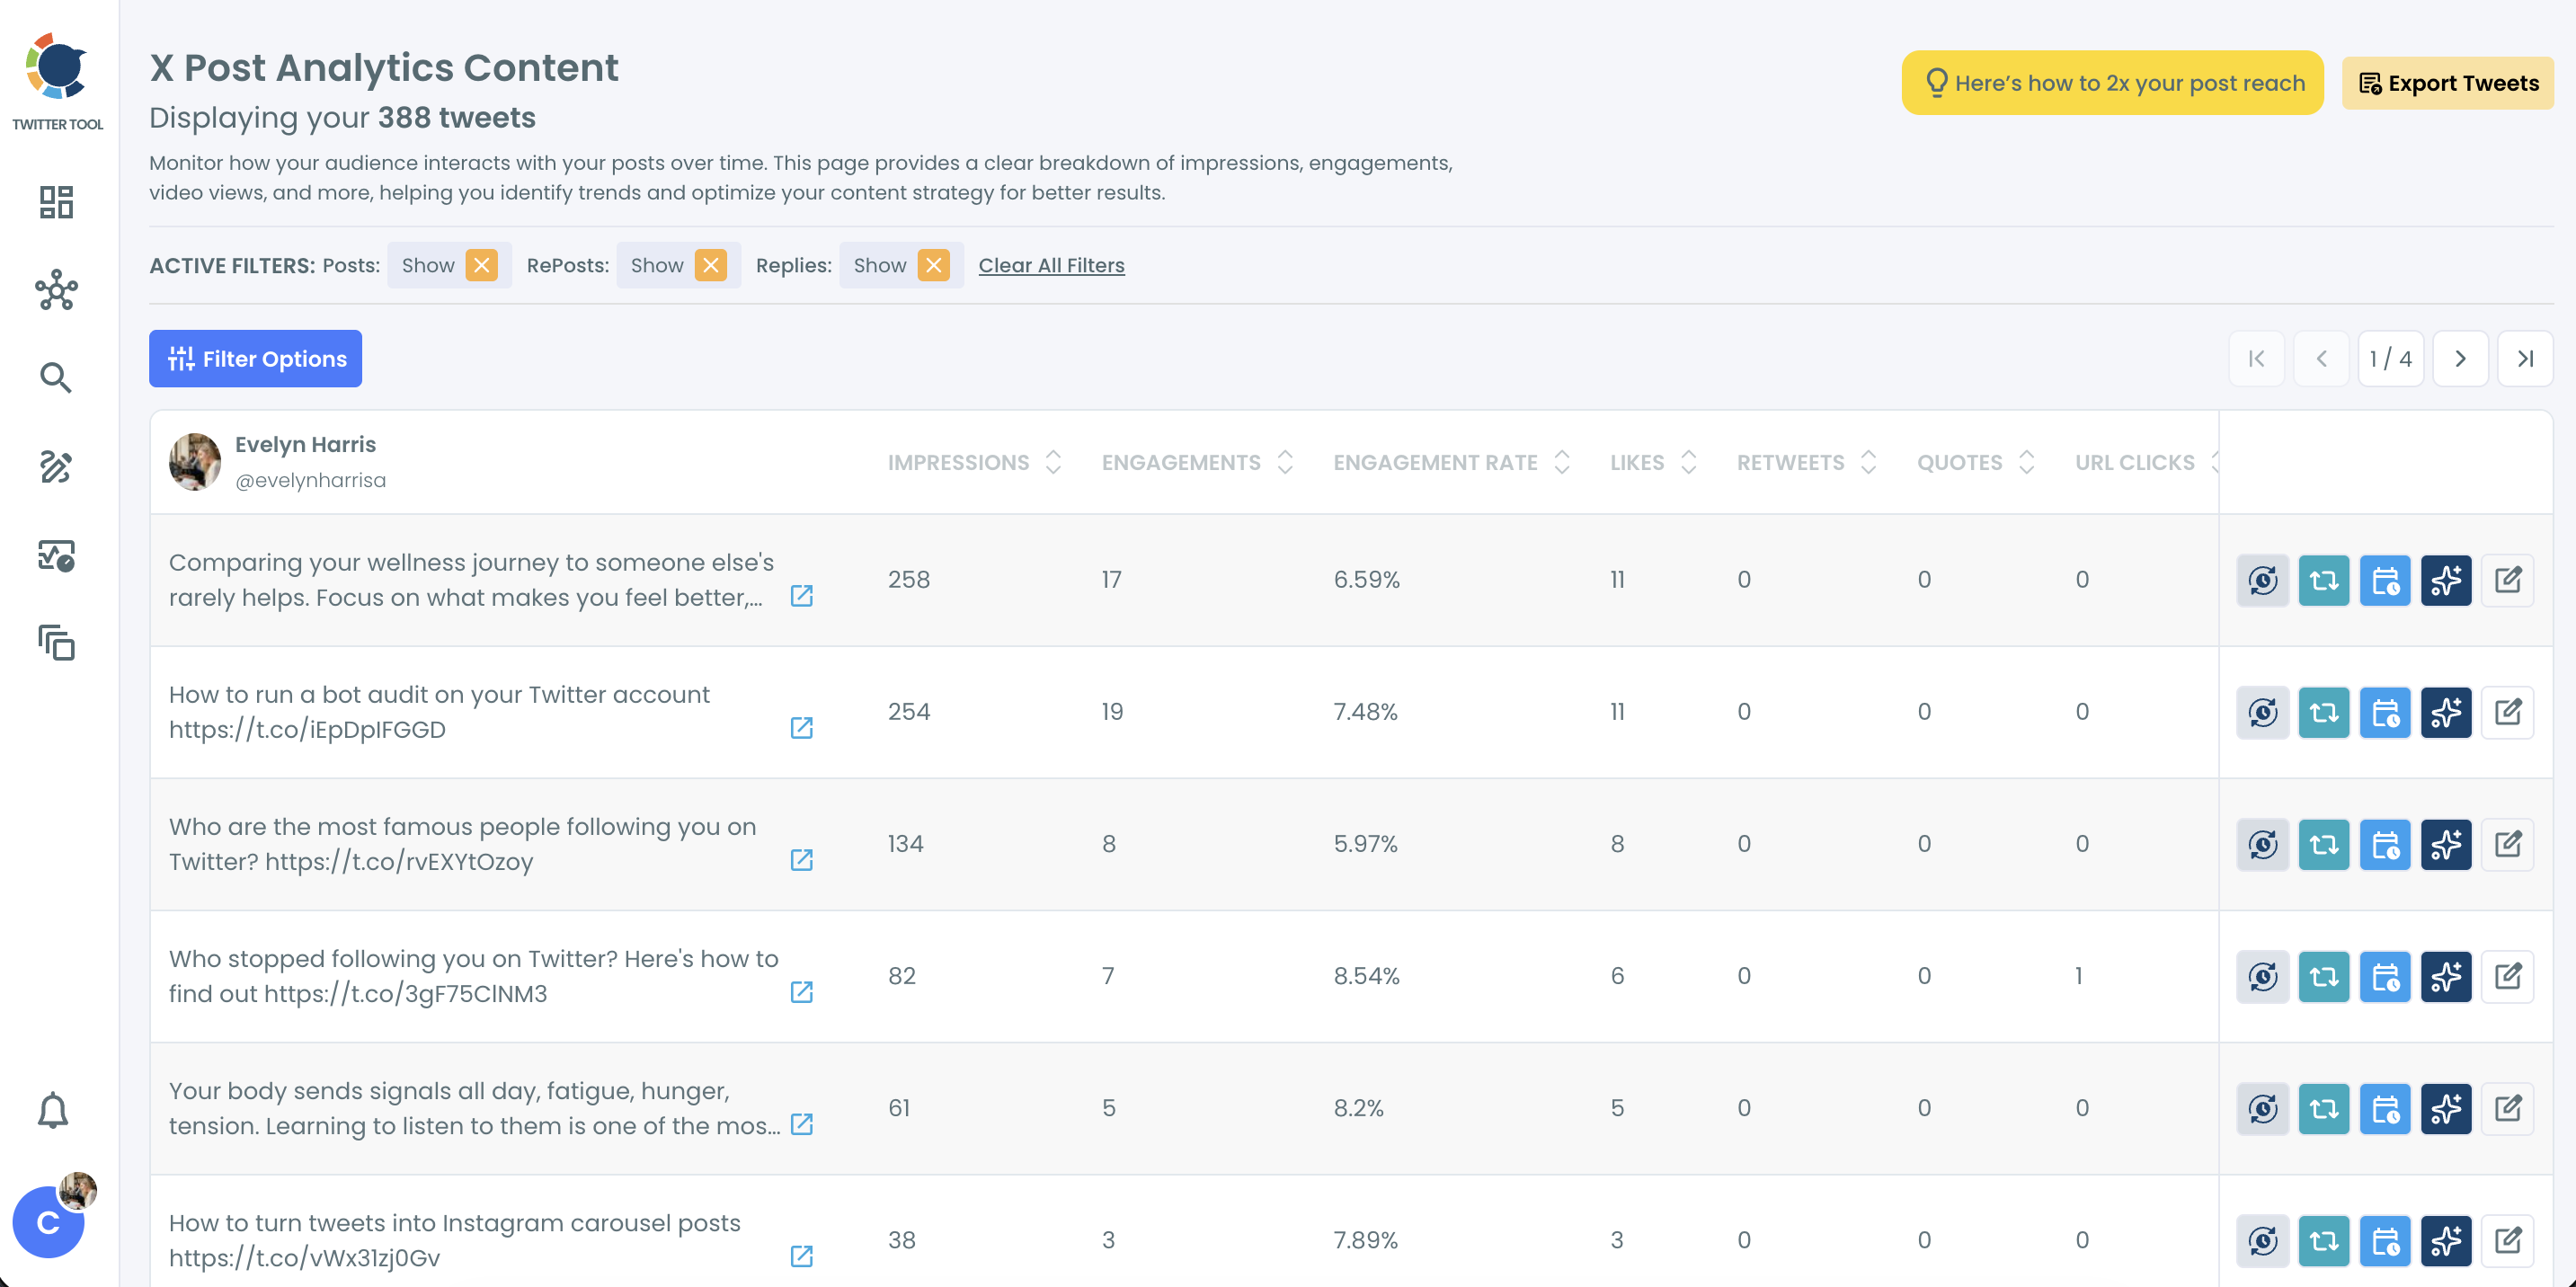
Post Engagement Analytics is the count side: a table of up to 3,200 recent posts, one row per tweet. It has a date-range filter and columns you can sort by impressions, likes, replies, engagement rate, and more.
Unlike copying view counts from each post into a spreadsheet, the two views give you a matched total and count in a few clicks. The numbers come from X itself, since Circleboom appears in X's Enterprise customer listing and reads them with approved access instead of a scraper.
To start with the right page open, work out impressions per tweet for any date range from the Post Analytics section.
How to calculate average impressions per tweet on X with Circleboom
The calculation falls into three phases: get the total, count the posts, then divide and check.
Get the impressions total for one window
- Log in to Circleboom Twitter and connect the X account whose average you need.

- Go to the X Post Planner menu and choose Post Analytics from it.

-
Pick the 4W range at the top right, or set a custom range in the calendar.
-
Set one Insights dropdown to Impressions and note the total on the Impressions card under the chart.
Count the posts inside the same dates
-
Open Post Engagement Analytics and set its date filter to exactly the same range.
-
Count the posts the table lists for those dates, leaving out any row with no impression data.
Divide, then check what moved the result
- Divide the Impressions total by the post count to get your average impressions per tweet.
- Sort the table by impressions and look at the posts far above and far below that average.
Matching the dates first is what makes the division trustworthy, and sorting last tells you whether the average describes a normal post or a few unusual ones. Skip the sort and one viral tweet can pass for a steady month.
When you want a longer record, save each month's figures so the averages can sit side by side. Keeping that history outside the dashboard is covered in how to export Twitter analytics.
Checking your numbers without X Premium: a walkthrough of opening your X analytics, impressions included, inside Circleboom.
Average or median: which impressions figure should you report?
Report the median when a few posts tower over the rest, and the average when the two figures are close. The median is your typical tweet; the average spreads every impression evenly, including the ones a single viral tweet brought in.
You can find the median in the same table you just used. Sort Post Engagement Analytics by impressions for your date range and read the post in the middle row. With 41 posts, that is row 21.
An illustrative month shows why this matters:
| 40 ordinary posts | 1 viral post | All 41 posts | |
|---|---|---|---|
| Impressions each | about 300 | 12,300 | |
| Total impressions | 12,000 | 12,300 | 24,300 |
| Average per tweet | about 593 | ||
| Median per tweet | about 300 |
One viral tweet works like a single tower on a street of houses: it lifts the average height of the street without adding a floor to any house. Here the average nearly doubles the typical post. Report 593 without the median and next month will look like a collapse, even if every ordinary post performs exactly as before.
For a quick cross-check, Circleboom's free metrics calculator shows Median Views / Post for your last 100 posts, which the calculator notes is steadier against a single viral post than the average.
In a client or partner report, give both figures on one line: the average for total reach, the median for the typical post.
The average answers how much reach you earned; the median answers what a normal tweet earns.
Which posts pull your average up or down?
The posts that sit far from your average in a sorted table are the ones moving it, and Post Engagement Analytics lets you isolate them by date, post type, language, keyword, and media type. Filtering one segment at a time shows whether a format lifts the average or drags it.
Circleboom's Twitter engagement analytics view is where that comparison happens. A useful order of checks:
- Filter by media type and compare the average for posts with images against text-only posts.
- Filter by keyword to see whether one campaign or topic sits above the rest.
- Filter by language, if you post in more than one, and calculate an average for each.
- Sort by engagement rate as well, since a post can pull the impression average up without earning replies.
Reading one segment against the whole account
A segment average works exactly like the account average: its total divided by its post count. An illustrative example with an overall average of 300 impressions per tweet:
- Image posts: 12 posts, 5,400 impressions, an average of 450.
- Text-only posts: 29 posts, 6,900 impressions, an average of about 238.
In that month, image posts lifted the account average and text-only posts held it down. Treat a segment of only a handful of posts with care, since one strong post can decide its whole average.
Video posts deserve their own look, because their impressions and their video views are different numbers. Circleboom's Twitter video analytics view shows video starts and completion stages beside each post's impressions.
Once you know which posts carry the average, act on them from the same table. Queue a strong post for a reshare, push it into a new scheduled slot, turn on auto-retweet, or open an AI rewrite draft that stays unpublished until you review it.
Why older posts can show zero impressions
Posts past a certain age can return zero or partial impressions because X stops returning analytics once a post passes its retention window. The gap is a platform limit, not missing activity, and it will drag your average down if those posts stay in the count.
Two related limits sit in the same table:
- Tweets from before your account was linked to Circleboom can lack impression data, which also leaves their engagement rate blank.
- Only your latest 3,200 posts appear in the table, so a very active account reaches that ceiling sooner.
The safe habit is to calculate on recent windows, such as the last 4 weeks or 3 months, and to leave empty rows out of the post count.
How much empty rows can move the result
The difference is easy to underestimate. In an illustrative 3-month window, 36,000 impressions spread over 110 posts with data is an average of about 327.
Count 10 empty rows as well, and the same total over 120 posts drops to 300, a fall of roughly 8% that no post earned.
If you connected your account recently, start your first window after the connection date. Circleboom's stored history grows the longer an account stays connected, so your comparisons get deeper each month you keep it linked.
The 1Y range reaches further back, but the older the posts, the more empty rows you are likely to meet.
If your average lands above, near, or below the 5% line
Your next move depends on where the average sits against your follower count and against the previous window:
- Above 5% and a green arrow: keep the format, and reuse the posts at the top of the sorted table.
- Near 5% with the median close to the average: your posts perform evenly, so test posting times before changing content.
- Average far above the median: a small number of posts made the month, so report the median beside it.
- Red arrow but a steady median: the previous window held an outlier, and your typical post has not changed.
- Below 5% on both average and median: compare formats by filter to find which kind of post falls short.
I check the fourth line first every month. Ruling out an outlier takes one sorted table, and it stops a false alarm before any content gets rewritten.
A single division gives you the number. The sorted table tells you whether to trust it.
→ Get your average impressions per tweet on X
Tweet impression averages on X: questions worth checking
What engagement rate should go with a good impressions average?
Aim for at least 0.5%: on X, 0.5–0.8% is good, 0.8–1.5% is very good, and more than 1.5% is excellent.
X's activity dashboard help defines the rate as engagements divided by impressions. A tweet engagement rate calculator checks one post; read a high rate on a low-impression tweet beside its raw counts.
What lifts a low per-tweet impressions average?
Give your top posts another distribution window from the reshare queue, and publish when your followers are online. Sort Post Engagement Analytics by impressions to choose which posts earn that second run.
Video-heavy accounts can read more on more impressions on Twitter videos.
How often should I recalculate my average?
Monthly is a practical rhythm, on the same window length each time. Circleboom's Post Analytics fits weekly or monthly reviews, and a 4-week range compared with the 4 weeks before keeps the reading steady.