
You search "how to check keyword ranking in Google Search Console" expecting a lookup: type in a keyword, get a rank, done. Instead you land in the Performance report, click around for a few minutes, and find a metric called "Average Position" that doesn't look like a rank at all. It's a decimal, like 6.3, and it doesn't seem to match what you see when you personally type the same keyword into Google right now.
That mismatch is the single most common source of confusion around Search Console. People assume GSC has a rank tracker hiding in a menu somewhere. It doesn't. What it has is a position metric that behaves differently from a rank tracker by design, not by accident, and once you understand what it's actually measuring, it becomes one of the more useful signals you have, just not the snapshot number you were expecting.
📢 How to use the Performance Report in Google Search Console
What Average Position Actually Is (and Isn't)
Average position is exactly what it sounds like: an average. For every individual impression Google counted for a query in your selected date range, Search Console records the top-most position your URL occupied on that search results page, then averages all of those individual position values together. If your page showed up at position 4 for one search, position 9 for another, and position 6 for a third, your average position for that query over that period is 6.3.
That is fundamentally different from what a rank tracker shows you. A rank tracker gives you a single point-in-time answer: "as of this morning, from this location, on this device, you rank #7 for this term." GSC gives you a blended average across every search instance it logged, which includes different users, different locations, different devices, logged-in and logged-out sessions, and personalized versus non-personalized results. Two people searching the exact same term at the exact same time can see your page in different positions because of local pack presence, search history, or device type, and GSC's number folds all of that variance into one figure.
This is also why checking your own ranking by manually Googling a term and comparing it to the GSC number rarely lines up. Your manual search is one data point, personalized to your account, your location, your device, and your search history. The GSC average position is drawn from a much wider, anonymized pool. Neither number is "wrong," they're just answering different questions.
It's also worth being precise about what average position doesn't capture. It's a numeric ranking of your organic blue link, but it says nothing about what else is on that results page.
A query where you average position 1.2 might still sit below a featured snippet, an image pack, a video carousel, or a block of ads, all of which push your actual visible placement on the page lower than the number implies. Position is about your slot in Google's organic ranking, not your visibility on the rendered page.
The Walkthrough: Checking Position for a Specific Query
Here's the actual mechanical process, step by step.
1. Open the Performance report
In Search Console, go to Performance in the left sidebar. By default this shows either "Search results" or, if you're on a platform property (more on that below), the equivalent report for that surface.
2. Set your date range
Click the date picker near the top and choose a range. The last 3 months or last 28 days are common starting points. Keep in mind the most recent day or two of data is usually still processing and will look incomplete or missing entirely, so don't panic if today's numbers look thin.
3. Enable the Average Position metric
Above the performance graph you'll see four toggleable metric chips: Clicks, Impressions, CTR, and Average Position. All four are usually shown by default, but if Average Position has been toggled off, click that chip to turn it back on. This adds a line to the graph and a corresponding column to the data table below it.
4. Go to the Queries tab
Scroll down to the table beneath the graph and click the "Queries" tab. This lists every search query that triggered an impression for your site in the selected date range, along with Clicks, Impressions, CTR, and Position for each one.
5. Filter to your exact keyword
This is the step people skip, and it's the one that actually makes the data readable. Click "+ New" above the graph, choose "Query," and select either "Query is exact match" or "Query contains" and type your target keyword. Exact match is what you want if you're trying to read the position for one specific phrase, since "contains" will blend in every longer query that includes those words, muddying the average.
6. Optionally filter by Page
If more than one URL on your site could plausibly rank for that keyword, add a second filter for "Page" and select the specific URL you're diagnosing. Without this, the position and click numbers you're reading might be an average across multiple competing pages on your own site, which defeats the purpose of isolating one page's performance.
7. Read the Position column and the trend line
With both filters applied, the table row for your query now shows the average position for that specific query and page combination, and the graph above shows how that position moved across your date range. A downward-sloping line (numerically, since lower numbers mean higher rankings) is improvement. An upward slope is decline.
Practical Tips and Edge Cases
Segment by device.
Add a "Device" dimension (via the same "+ New" filter flow, or the Devices tab) and check mobile against desktop separately. It's common for the same query to show a meaningfully different average position on mobile versus desktop, because Google's results, local pack placement, and even the set of ranking pages can differ by device. Looking only at the blended all-devices number can hide a mobile-specific problem or win.
Segment by country.
The same logic applies geographically. If your keyword has commercial intent tied to a specific market, filter by Country and check the position there specifically. A blended global average can look mediocre while the position in your actual target market is strong, or vice versa.
Watch for low-impression queries that don't show up cleanly.
Search Console omits or aggregates some very low-volume queries for privacy reasons. If you're checking a brand-new keyword you just started targeting, or a genuinely low-search-volume long-tail term, don't be surprised if reliable position data takes time to accumulate or doesn't appear as a distinct row at all.
Use the trend line for diagnosis, not just observation.
The real value of the position graph is correlating a shift with a cause. If you published a content update, changed a title tag, or Google rolled out a core update, overlay that date mentally against the position line for that query. A sustained move up or down that starts right around a known change is a much stronger signal than a single day's fluctuation.
Don't over-read daily noise.
Because average position is recalculated from whatever impressions happened to occur that day, single-day spikes or dips are common and often meaningless, especially for lower-volume queries where a handful of unusual impressions can swing the daily average. Look at the trend over weeks, not days.
Does GSC Show My Exact Keyword Rank? (And Other Common Questions)
Does Google Search Console show my exact keyword rank?
Not in the way a dedicated rank tracker does. It shows an average position calculated across all the impressions for that query in your selected date range and filters, which reflects a range of devices, locations, and personalization states blended into one number. It's a genuinely useful directional signal, but it is not equivalent to "the rank you'd see if you searched this term right now."
Why does my manual Google search show a different rank than GSC?
Because your manual search is one personalized data point from one location, device, and account, while GSC's average position is drawn from a much broader, anonymized set of impressions over your chosen date range. They're measuring different things and won't reliably match.
Can I track competitor rankings in Google Search Console?
No. GSC only reports data for properties you've verified ownership of. There is no way to pull position, click, or impression data for a competitor's domain inside the tool. That's a gap dedicated rank trackers and competitive SEO tools are built to fill.
Why don't some of my keywords show any position data at all?
Very low-impression queries are sometimes omitted or aggregated by Google for privacy reasons, which particularly affects brand-new keywords you've just started targeting or naturally low-search-volume long-tail terms. Give it time and check back once the query accumulates more impressions.
Is a lower average position always better, and is position 1 always the top result?
Lower numbers mean higher average rankings, so position 1.0 is as good as it gets numerically. But numeric position 1 doesn't guarantee your result is the first thing a searcher sees on the page. Featured snippets, image packs, video carousels, and ads can all sit above the organic block and aren't factored into the position number, so your actual visible placement can be lower than the metric implies.
When should I use a dedicated rank tracker instead of relying on GSC?
When you need a single point-in-time snapshot for a specific location and device combination, when you want to track competitor positions, or when you need visibility into who owns SERP features like featured snippets or People Also Ask boxes. GSC genuinely can't provide any of those. For trend direction and diagnosing why a page's performance is moving, GSC's own data is usually sufficient and it's free.
Ranking Is About to Get Bigger Than Your Website
Everything above assumes "checking your ranking" means checking a URL on your website. That assumption just got narrower than it used to be. In July 2026, Google added a new property type to Search Console: alongside the standard URL-prefix and domain properties, site owners can now register a platform property for Instagram, TikTok, X, or YouTube, letting them see how content on those platforms performs specifically within Google Search and Discover results.
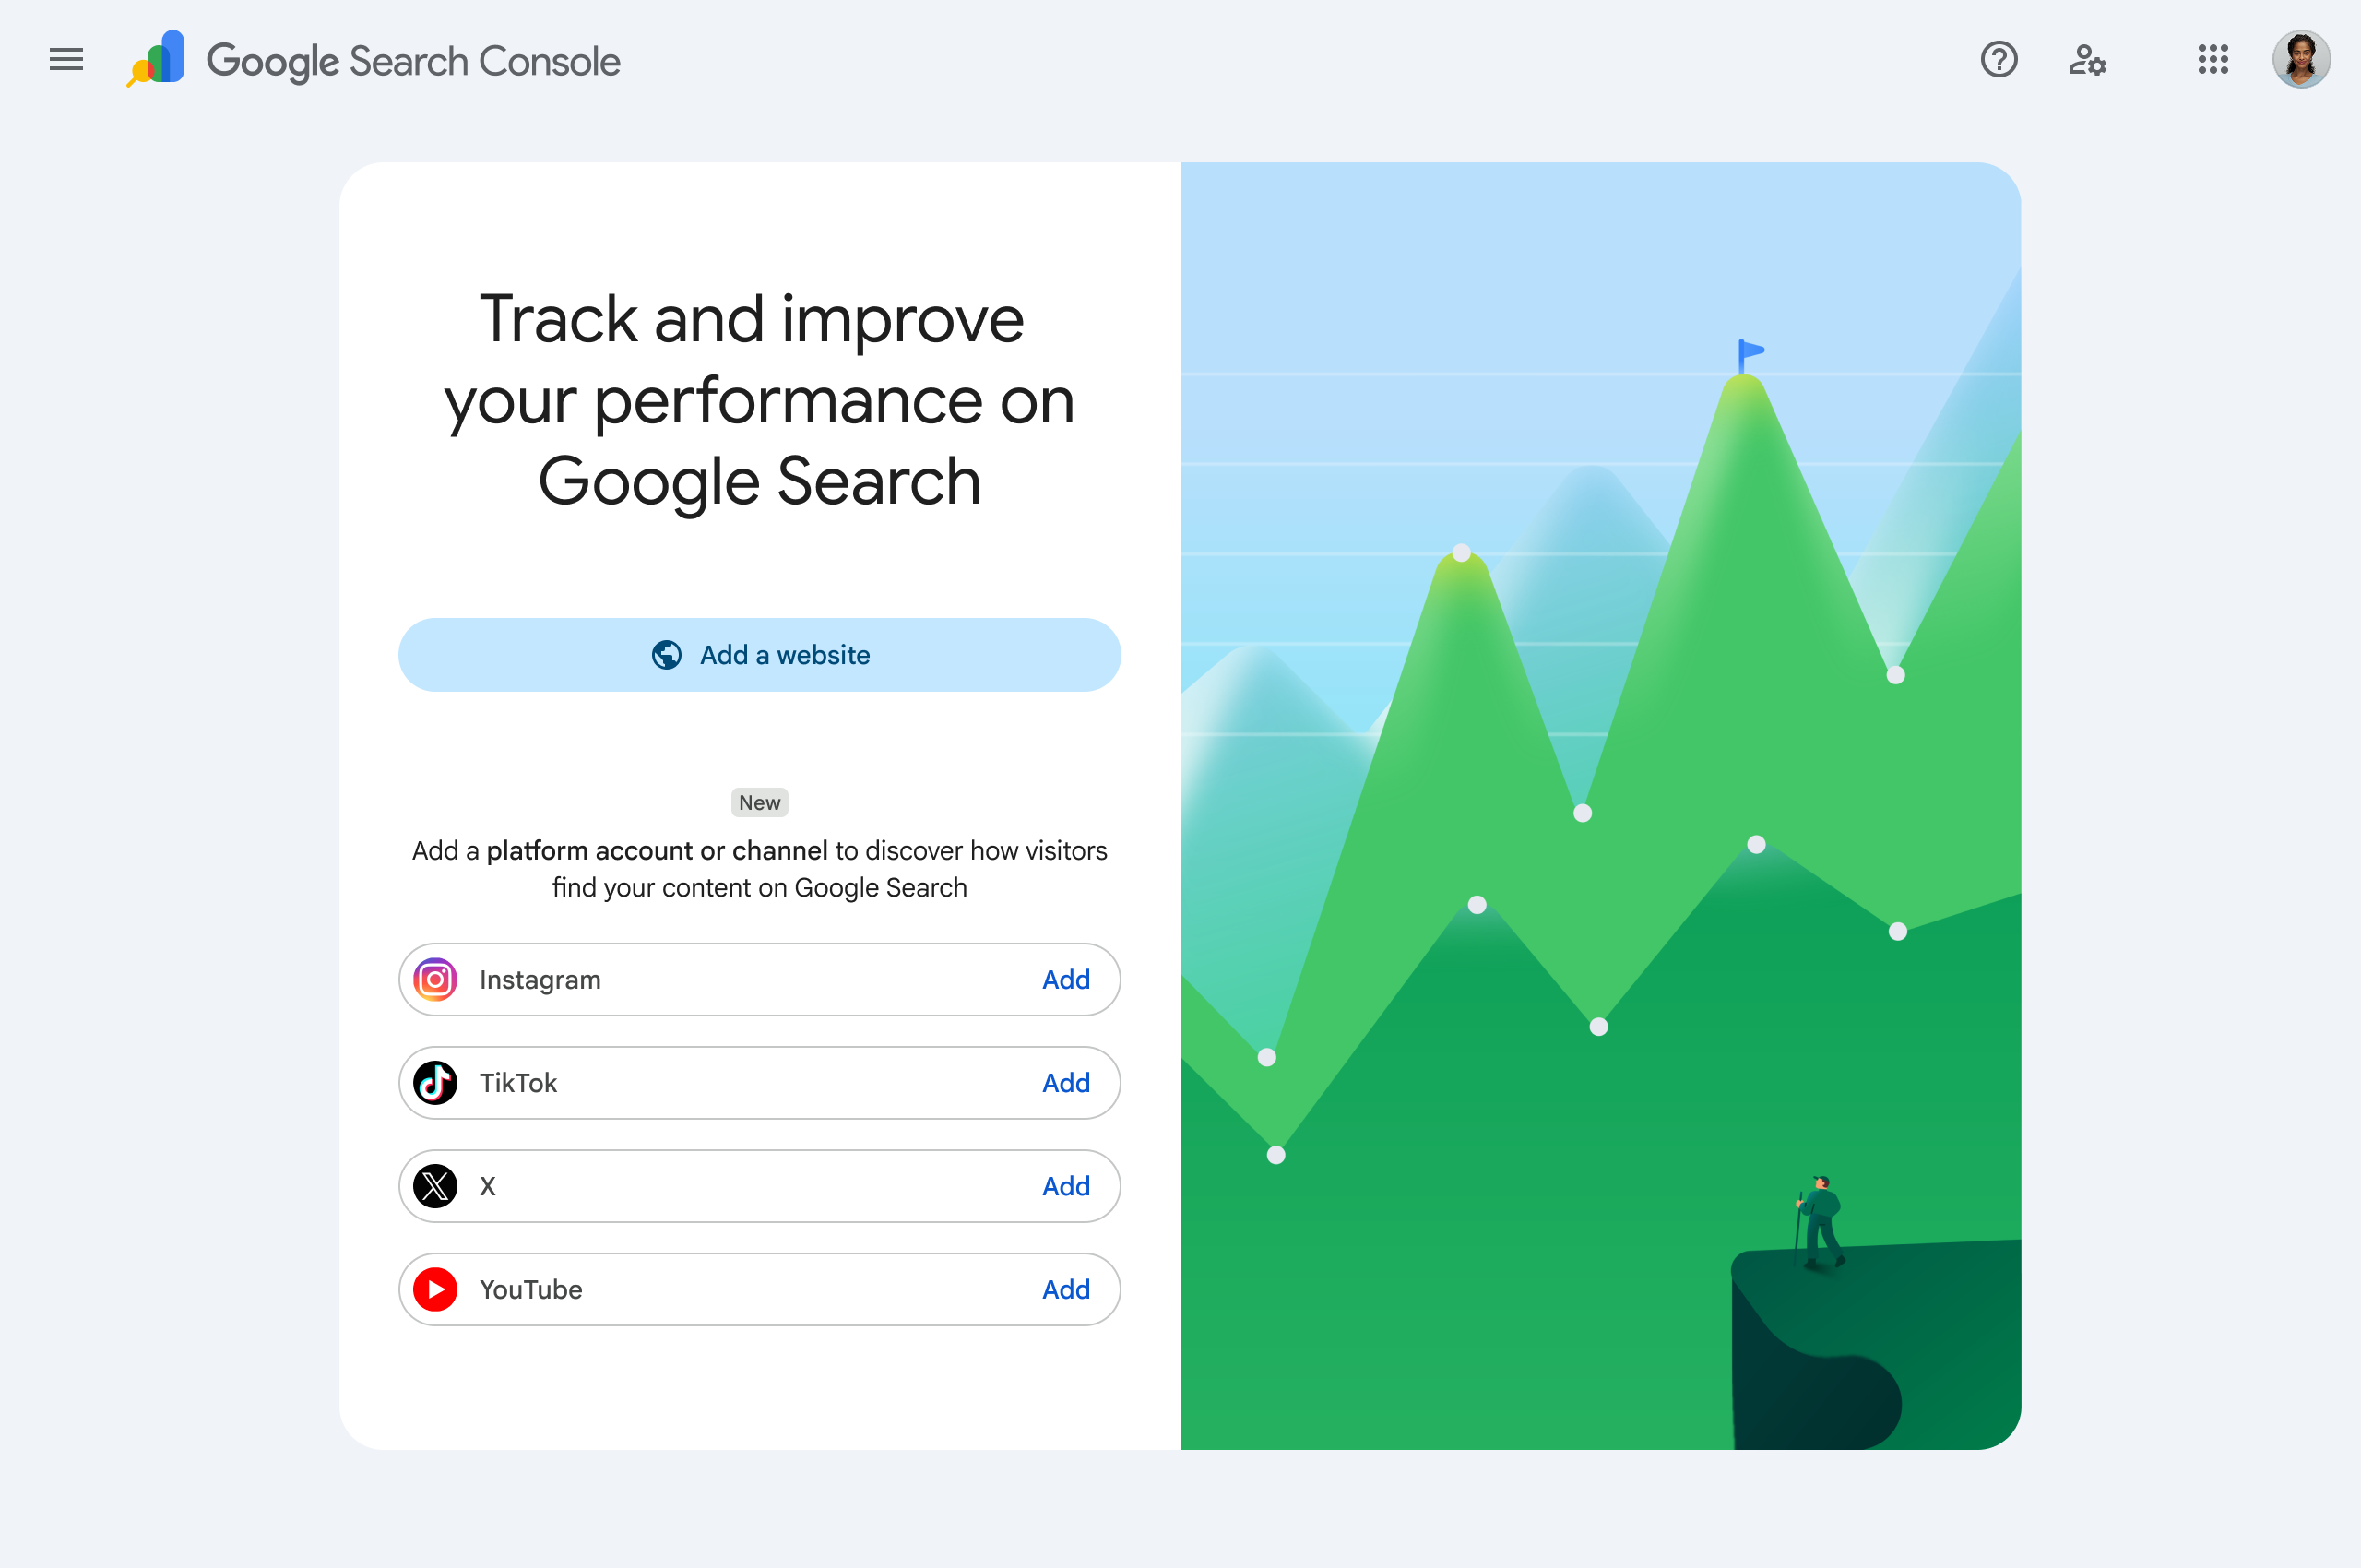
That's a meaningful shift in what "SEO" is even scoped to. Google has been surfacing social and video content in Search and Discover for a while, tweets showing up in results, TikTok videos appearing for how-to queries, YouTube content dominating certain SERPs, but there hasn't been a first-party way to measure it the way you measure a website.
Now there is, and it uses the same underlying logic covered in this guide: impressions, clicks, CTR, and average position, just applied to a piece of platform content instead of a URL on your domain.
Practically, this means a brand can, for the first time, ask "how is my X account's content positioned when it shows up in Google Search or Discover" and get an actual first-party average-position answer, the same way they'd ask that question about a blog post. That's a genuinely new lens on content that previously lived entirely outside the search-measurement conversation.
It's also a natural complement to the analytics a platform-focused tool already gives you, rather than a replacement for it.
Circleboom's Post Analytics and Analytics suite for X already track engagement, video performance, audience growth, and audience behavior for content published through the X Post Planner, that's the "how did this post perform with people" side. A GSC platform property would newly cover the "how did this post perform in Google Search and Discover" side, which is a different, previously invisible layer of reach. Together they start to sketch a fuller picture of where a piece of content actually shows up and to whom.
The other half of the equation is simpler: none of this matters for content that isn't being published consistently.
Circleboom's scheduling and automation tools for X, and its scheduling and automation support for Instagram, TikTok, and YouTube, are what keep content flowing onto these platforms in the first place, which is the precondition for any of it having a chance to appear in Google Search or Discover at all. Ranking, in other words, is no longer just a website exercise. It's starting to apply to wherever your content actually lives.
Next Step
If you haven't looked at your Performance report's Position column with a real query filter applied, that's the first thing worth doing today: pick your highest-priority keyword, apply an exact-match Query filter and a Page filter, and read the trend line for the last three months before you draw any conclusions.
And if you're publishing regularly to X, Instagram, TikTok, or YouTube, it's worth keeping an eye on Google's platform property rollout, since it's the first real first-party way to see how that content shows up in Search and Discover, not just in-app.