
A student or academic who wants to compare politicians on Twitter usually hits the same wall at the writing stage: the data was gathered on different days, by different means, and nobody took a snapshot when the study period opened.
X does not let you go back and collect last spring's audience.
This guide sets up the comparison so the record exists before you need it.
Manual collection: weeks of hand-copied figures on mismatched dates, with no record of the audience on day one. Circleboom: one fixed set of up to 5 public X accounts, compared on a monthly schedule through official X Enterprise APIs, with every run dated and saved.
→ Schedule dated comparisons of political accounts for your study
The first run is your baseline, so take it before the period starts.
Why one snapshot cannot carry a study of political accounts
A single report describes one date, and a study asks what changed.
Audience figures describe the audience on the run date, so two reports months apart give you a series, while one report gives you a picture with no direction in it.
Two runs show a direction, and four start to show a trend.
The usual mistake is starting the data work when the writing starts. By then the opening audience is gone.
You can set up a comparison of politicians on Twitter in advance, and that baseline costs far less than a missing first chapter.
Two limits shape your sample before anything else. Only public accounts can be analyzed, and any account above 3,000,000 followers cannot be analyzed, so settle your panel against that cap at the design stage.
How much history does a monthly comparison cover?
Each run retrieves followers, following and up to about 3,200 recent tweets per account, so coverage depends on how often an account posts. Frequent posters cover a shorter period, and that difference belongs in your methods section.
The table below is an illustrative calculation, not a measurement of any account:
| Posts per day | Days covered by 3,200 posts |
|---|---|
| 40 | 80 |
| 20 | 160 |
| 5 | 640 |
| 2 | 1,600 |
An active candidate posting 40 times a day during a campaign may have about 80 days in the window, while a quieter peer has more than four years.
A shared run date does not mean a shared study period.
Re-running refreshes a rolling sample, so three things can move a figure between runs:
- New posts entered the sample.
- Older posts left it.
- Posts already in it gained more interactions.
Record this in your notes each month.
Before you compare two accounts, check the available post dates and the sample size, since a calendar-month chart and an average across the retrieved sample answer different questions.
That distinction decides how much weight your analysis can put on a change.
How to compare politicians on X across a study period
Here's the flow, in order. You set it up once, and after that the schedule keeps producing the record.
Choose a panel you can keep for the whole period
- Open Circleboom Twitter and connect your X account.

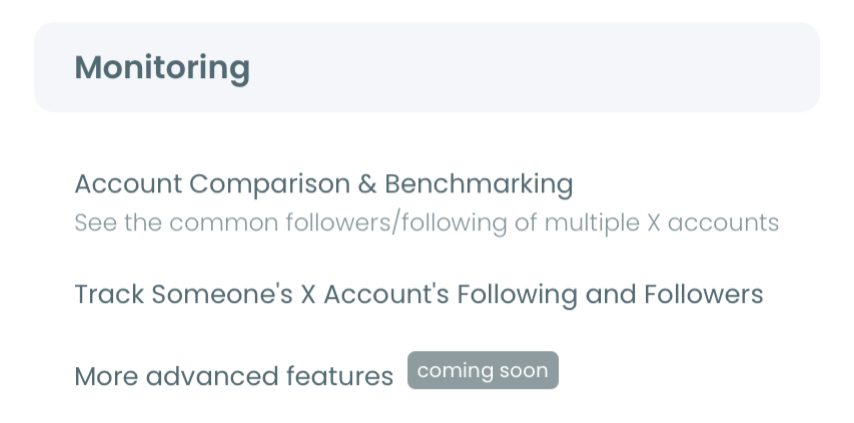
- Go to the Monitoring menu and select the X Competitor Analysis & Benchmark Report feature.
- Enter your same-office set under Account Handles, up to 5 public handles in total. You can leave your own account out.
Take the baseline and set the schedule
- Select Start Competitor Analysis before your study period opens, so the first report records the starting audience.
- Choose Keep it up to date every month, then set MONTHS to your period and FIRST MONTHLY REPORT ON to a fixed day of the month.
- Check the cost on screen. Competitor Tokens are charged per competitor per report, so 5 accounts on a 12-month schedule is 13 reports and 65 tokens, and 4 accounts is 52.
This order matters because each decision limits the next: the panel fixes what can be compared, the baseline fixes where the series starts, and the fixed day keeps the gaps between reports even.
Change the panel later and the series breaks at that point.
Quick recap:
- Pick a same-office panel under the follower cap.
- Run the baseline before the period opens.
- Schedule monthly reports on a fixed day.
If you want to see the output first, the sample competitor report runs on public payment brands.
When your design is ready, you can compare politicians on Twitter month by month from the same page.
Which report sections answer which research question
Match each research question to the section that holds its evidence, so you collect one record and read it several ways.
The report has 9 sections, and the same layout repeats across every account in your panel.
| Research question | Section to read | Caution |
|---|---|---|
| Who follows these accounts? | Audience Quality, Demographics | Group figures only |
| How do they publish? | Posting Behavior | Burst may reflect events |
| Who interacts with posts? | Engagement | Volume is not approval |
| Which posts travel? | Impression/ |
Displays, not people |
| Do audiences overlap? | Common Audience | One pair at a time |
The cadence panel deserves a place in any campaign study. It prints a lifetime average next to a last-30-days average for each account, so a change in output shows up without any extra collection.
That panel also helps with attribution.
A drop across your whole panel points to a shared change, while a drop in one account points to that account.
A single-account study cannot separate those two readings, which is the strongest methodological reason to compare politicians as a set.
The posting consistency label adds a useful variable as well, since it marks each account Steady or Burst with a CV number. A burst may reflect a debate or a campaign event, so read the label against your event log before you interpret it.
Higher CV means more uneven posting, and it does not show better or worse performance.
What a study of political accounts on X cannot get from the report
Some measures sit outside the report, and your design should say so. Profile visits, URL clicks and video retention curves appear in no column, and the report has no @-mentions metric, so a question about who mentions a politician needs a different data source.
How to keep the comparison dated through a whole campaign
Keep one fixed panel, one fixed run day and a written log, and read each new report against the last one in the same order. Your earlier runs stay under Past Analyses on the set's saved card, so nothing gets overwritten.
Read each pair of dated runs in this sequence:
- Per-post averages, because they show how a typical post performed.
- Monthly totals, because they rise and fall with posting volume.
- Audience composition, because it describes the retrieved audience on that date.
Keep a short log beside the series. Note debates, election days, candidates leaving the race and platform rule changes, because you will want them when a chart moves.
Past coverage of Twitter's new policies on ongoing US elections and COVID-19 shows how platform rules can shift mid-campaign.
If a candidate drops out, report that change and do not read a new group as a change in position.
Use End Scheduling when the study period closes.
For posts on a specific issue, which the account-level report does not break out, add the Real-Time Tweet Tracker to your method.
For your own coding of posts, Export Tweets gives you a CSV of one account's last 3,200 tweets, bought per export with no tokens.
Can a study say a politician's X followers are fake?
A study can report a suspected share as Circleboom's classification on a stated date, and it cannot claim the accounts are fake. The label is an analytical signal for review, based on account signals, and is not a verified identity judgment.
Report the percentage and the count together. A smaller share of a larger list is often more accounts, so either figure alone can mislead.
Quality tiers add a further read, since they combine activity, follower-to-following ratio and account age.
Your reviewers may ask how such signals work in general. The piece on AI-made fake Twitter profiles covers why they can distort analytics.
For manual validation on a subsample, these ways to identify fake Twitter accounts give a starting checklist.
Inter-coder checks of that kind strengthen a paper, and I would keep individual accounts anonymous in anything you publish.
How to cite a comparison of political accounts in a paper
State the tool, the data source, the accounts, every run date and the sample basis in your data section, and separate retrieved fields from calculated ones.
Circleboom is an official X Enterprise Developer retrieving source records, and its demographic and quality figures are Circleboom analysis of those records, not official X verdicts.
Your methods paragraph should cover these points:
- The panel, how it was chosen and any changes to it.
- The first and last run dates, plus the monthly day.
- The sample basis of up to about 3,200 recent tweets per account.
- Which figures are retrieved and which are calculated.
- That engagement rate is total engagement divided by total impressions.
Keep the raw reports as your appendix. Each run stays dated under the saved set, which helps when a reviewer asks where a figure came from.
What the following list adds to a study of political accounts on X
The Following toggle describes who each politician chose to follow, which is a hand-picked list and a separate variable from their audience.
A toggle redraws the audience panels for that list, while posting and engagement panels stay identical because they describe the account's own posts.
In our sample report on public accounts, the follower side of four payment brands ran 2% to 3% verified, while the following side ran 25% to 47% verified. The gap shows how different the two lists can be, and a political panel may show its own pattern.
The time-zone panel below is one example of that view.
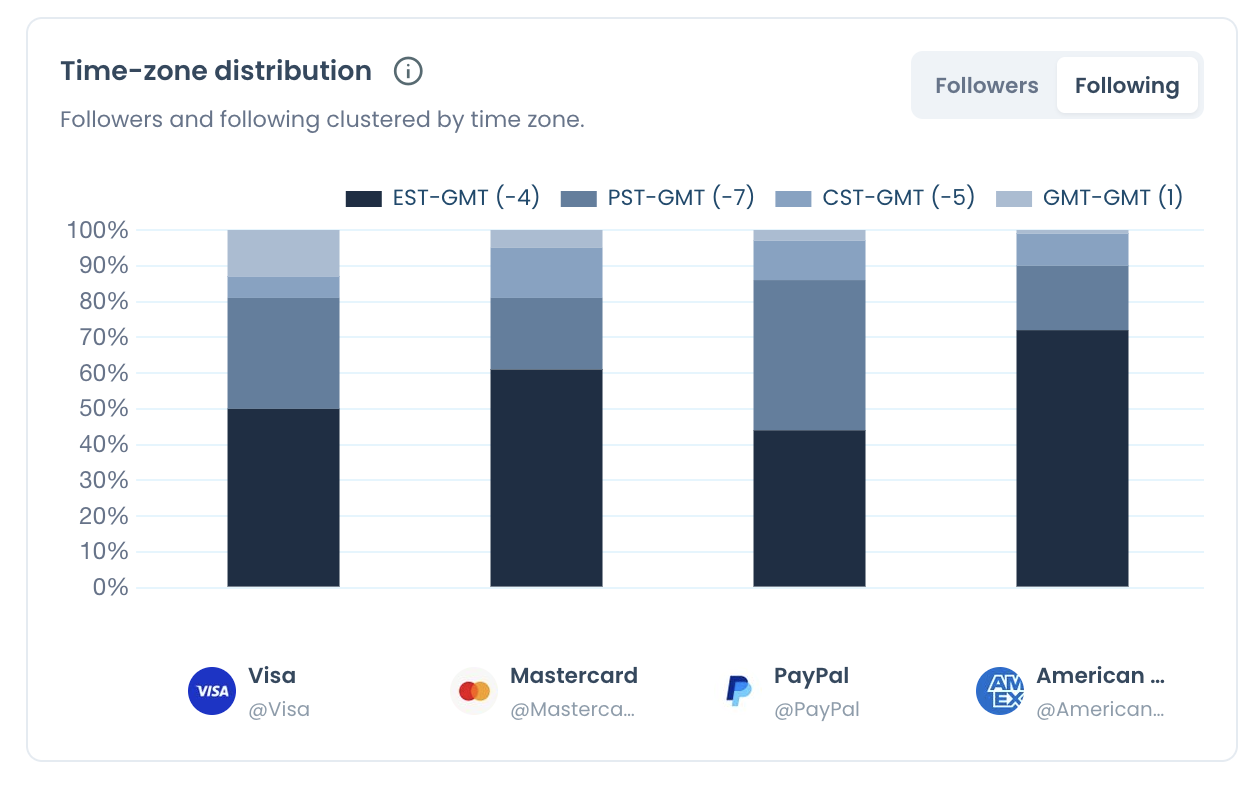
For a research question about elite networks or press relations, this is often the more useful side, and the bio keyword cloud shows what the followed accounts say they do.
Never report following-side percentages as audience data.
Summary of the research setup
To compare politicians on Twitter across a research period, fix a same-office panel, take the baseline before the period opens and schedule dated monthly runs. Record the rolling window and each account's real coverage, cite classifications as Circleboom analysis, and keep a log of outside events.
The report describes the sample. It cannot show voter intent, and it cannot predict an election, so keep your conclusions to what the sample supports.
→ Begin your baseline comparison of politicians on Twitter
Research FAQ on comparing political accounts
Are a politician's followers in their country?
The Circleboom geographic panel shows the four largest countries for that account's followers plus an Other bucket, so it describes representation on X, not citizenship or voters. Named countries change between reports, so confirm a country appears in both before comparing it.
This explainer on Twitter followers by country covers the wider question.
Can I treat replies and quotes as a measure of support?
No. Both measure conversation on X, and Circleboom's report notes that replies can include questions, criticism, support or spam, and quotes can support or challenge the post. Code a sample of the actual text if your question concerns sentiment.
What if a politician in my panel has over 3 million followers?
Circleboom cannot analyze that account in the report, so it needs a separate note in your design. The free Twitter X Metrics Calculator can read its last 100 posts, but that rate uses followers as its basis, so treat it as a separate source.
Which politicians make a fair panel for one study?
Accounts holding or seeking the same office, in one market and language, with a similar publishing purpose make the fairest panel. Justify the choice in your methods, and treat much larger figures as reference cases, not as benchmarks for the rest.