
Are you behind your rival on X, and on what?
To compare your Twitter account with a competitor, read its 9-section report in a fixed order that answers those two questions one at a time.
How do you compare your Twitter account with a competitor?
Put your handle in the first slot, add up to 4 rivals, and read one side-by-side report in a fixed order. With Circleboom, you can run that comparison on X through official X Enterprise APIs.
→ Add your handle and four rivals to compare your account on one page
Why scanning the X report gives you the wrong answer
Scanning fails because the first row you see is the Essentials table, and its figures do not explain themselves. It carries follower count, one engagement rate and one average impressions figure, and people stop there.
The mistake is expensive.
A rival ahead on monthly totals but level on per-post averages is ahead on volume, and the fix is a schedule rather than a new content strategy.
I see first-time users skip that check more than any other.
A method also protects you from your own bias. Before I fix an order, I tend to go looking for the chart that flatters the account I am working on.
If you already know the question, you can benchmark your Twitter account against a competitor in the same sequence every time, and two runs months apart stay comparable.
What you get when both X accounts sit in one report
With Circleboom, you can put your X account next to up to 4 named competitors, or compare up to 5 other accounts, in one 9-section report built from a single dated pull.
The same charts and tables repeat for every account, so each metric reads straight across the set.
This matters more than the number of charts. Counting a rival's posts by hand and copying their likes gives you figures that were each gathered differently, and the first follow-up question takes them apart.
A report also stays useful after the meeting. You can run a competitor benchmark on your X account today and open the same handle set again next quarter, with each result stored under its own date.
Which accounts should you pick as competitors on Twitter?
Pick direct peers: accounts that share your target market, language, account scale, publishing purpose and business model.
Industry alone is too loose, since a regional support account and a global entertainment-led brand can sit in one sector and serve different goals.
Category leaders belong in a separate run. They are useful for studying an approach, but their raw totals are a poor target for an account with fewer resources.
Keep these three rules for the set:
- Use direct peers to measure your position and leaders only to learn from.
- Keep the same handles across runs, and say so when you swap one.
- State which kind of set you used whenever you share a result.
The comparison defines what winning means.
If you swap in a weaker rival to look better, the report still calculates correctly, and the answer no longer means anything.
If you also want a look at how those rivals behave week to week, how to track other people's activity on X covers the separate monitoring side.
Is your competitor's Twitter follower count real or padded?
Audience Quality answers this with a suspected bot share, an inactive share and quality tiers.
It shows them for every account in the set.
A follower count is cumulative, so an old account carries everyone who ever followed it, including accounts that stopped posting years ago.
Read the percentage next to the raw count, because a smaller share of a bigger list is often more accounts.
A sample report on public accounts compares four payment brands, Visa and Amex among them.
In it, the 1.1M-follower account carried a 34% suspected bot share (377,048 accounts) and a 63% inactive share. Its High quality tier was the smallest in the set, at 2%.
A quick calculation shows why this changes the conversation. A rival with 50,000 followers at 40% inactive has about 30,000 active followers, and your 35,000 at 85% active is about 29,750, so the two audiences are nearly even.
The sample figures describe that report on its run date, and a drill-down list lets you open the flagged accounts rather than trust a percentage.
These are signals for review, and an account that rarely posts may still read everything.
Want the logic behind that kind of audit on one rival? See how to analyze somebody's followers and following on Twitter.
How to compare your Twitter account with a competitor, from handles to verdict
Here's the flow, in order. Setup comes first, then the five reading steps that give this method its name.
Set up one run so the basis stays the same
- Log in to Circleboom Twitter and connect your X account.

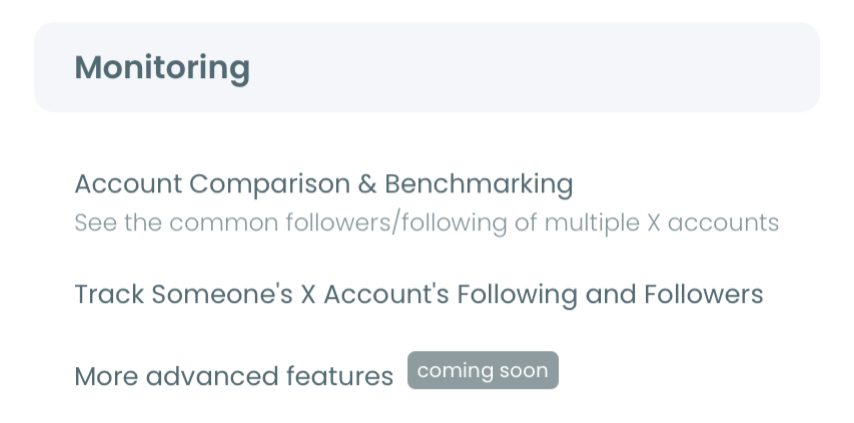
- Go to the Monitoring menu and pick the competitor report, the first item on the list.
- Type your handle into the first slot under Account Handles.
- Add up to 4 rivals with the + button, and watch the "N of 5 competitors added" counter.
- Press Start Competitor Analysis, then select Just this once for a first look.
Every account above must be public and at or under 3,000,000 followers.
Each comparison uses up to about 3,200 recent tweets per account, which is a rolling sample rather than full history.
Read the report in this order to answer "are we behind, and on what"
- Scan the Essentials row for context only. Note followers, active followers, account age, engagement rate and average impressions, and draw no conclusion yet.
- Open the Engagement summary. Compare average likes, reposts, replies, quotes and bookmarks per post, since these columns are averages rather than totals.
- Check cadence in Posting Behavior. Compare Lifetime Average with Last 30 Days Average to separate a volume gap from a per-post gap.
- Move to Impression/Views. Read Total impressions overtime beside the average per tweet to see whether your posts were shown at all.
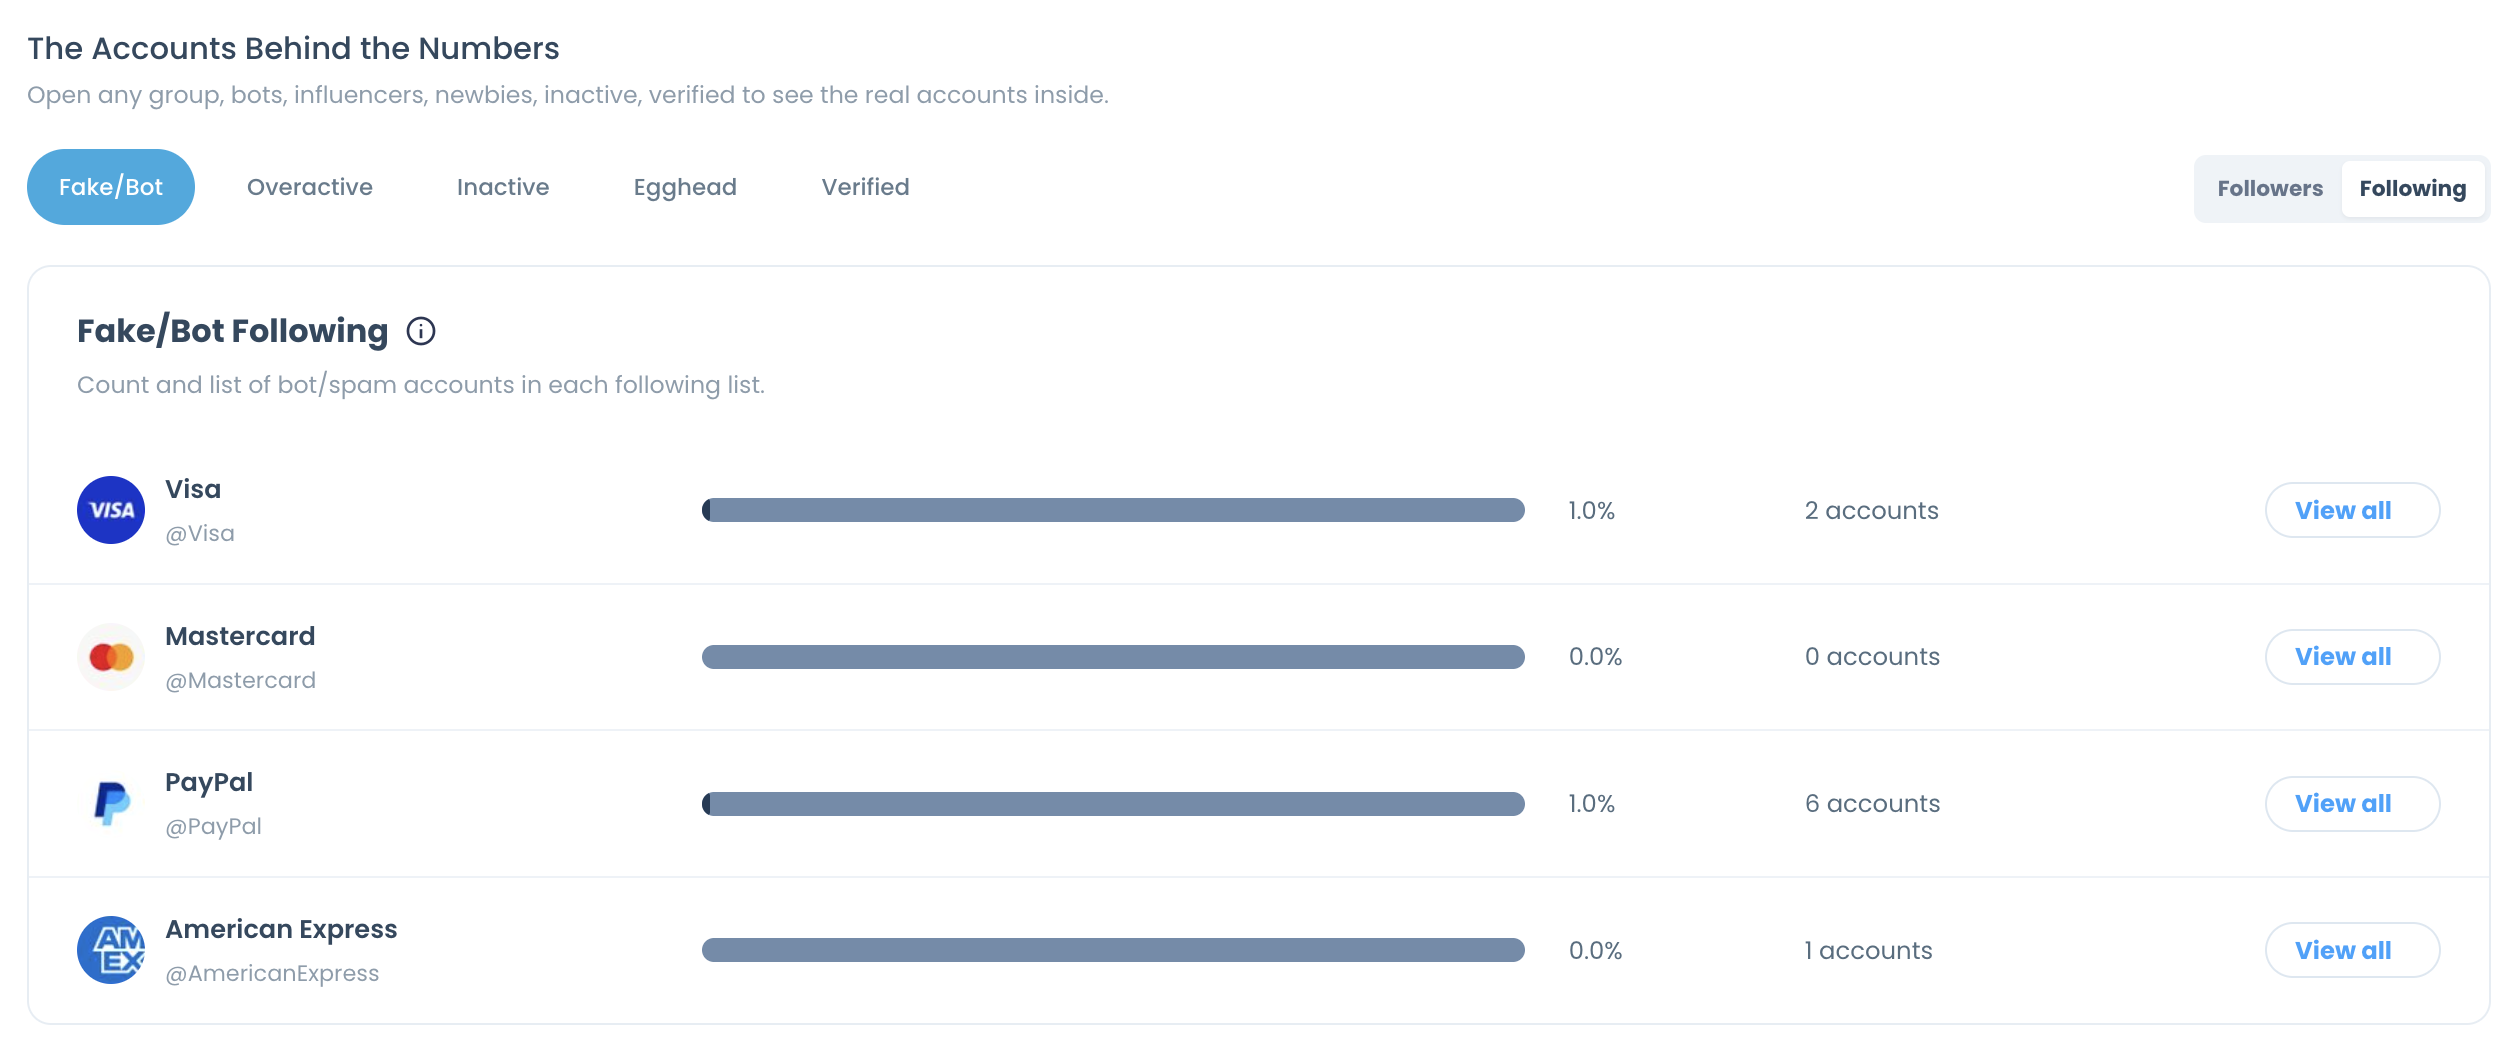
- Finish in Audience Quality. Use the Followers / Following toggle to see what sits behind each number, including the accounts each rival follows.
The sequence works because each step rules something out before the next one costs you time.
By the fifth step, you know whether the gap sits in output, in the posts themselves, in visibility or in the audience.
What each X report result means for your next decision
Each pattern your reading turns up points to a different piece of work, and they cost very different amounts to act on. Use this table to read your own result:
| What you see | What it means | First thing to check |
|---|---|---|
| Behind on totals, level per post | A volume gap | Your posting cadence |
| Level on impressions, behind per post | An interaction gap | Top posts by engagement |
| Behind on average impressions | A visibility gap | Posting-time overlap |
| Ahead per post, thin active share | An audience question | Inactive drill-down |
Checks to run before you trust the table
That table holds when you compare like with like, so check the post dates first. The same number of retrieved posts covers a shorter period for a frequent publisher than for an occasional one.
Engagement rate needs one extra caution. In this report it is total engagement divided by total impressions, so it says how often people shown a post interacted with it, and it is not a share of followers.
Don't look for a follower-ratio column either, because the report has none.
One trap catches new users in the timing panel. Its subtitle mentions a score, but the output is the visual overlap between two curves, Posting Time and When Users are Online.
To go deeper on a single rival's posts, how to analyze someone's tweets picks up where the leaderboards stop.
Your own side of the comparison can go further with how to check analytics on Twitter without Premium.
When a rival is no longer the question, the Twitter account analysis handles your account on its own.
How to reach your competitor's followers on X once the comparison is done
Open Search Twitter Followers, enter the rival's handle, and review their list for accounts that match your topic.
This step makes sense only after the Audience Quality read, because you now know how active that audience is.
The report also gives you a useful filter: bio keywords. If "founder" and "marketer" lead a rival's audience keywords, those words tell you which profiles to shortlist and which subjects to write about.
Paid is the other route. If you would rather put a budget behind it, read whether you can target your competitors' followers with Twitter ads before you plan the campaign.
Why the first run is worth saving as your Twitter baseline
Save your first report as the baseline, because two dated runs show a direction and one run shows only a position.
Each run is stamped and stored under Your saved analysis, and earlier runs stay under Past Analyses.
The mistake I see most often is reading a moved number as the result of a decision.
A re-run refreshes the sample, so an average can change through new posts, older posts dropping out, or extra interactions on posts already included.
Confirm a change in more than one section before you claim a cause.
For a repeating review, Keep it up to date every month produces one new report each month, and End Scheduling stops it at any time.
That monthly habit is what lets you tell a category-wide dip from your own, since a decline across all five accounts is a market condition and a decline on one is that account's.
Trust matters at this stage too, particularly if the report goes in front of leadership or a client. Circleboom is an official X Enterprise Developer, so the figures trace to official X records.
Scraping-based collection can miss records or return incomplete fields.
The bot, quality and demographic figures are Circleboom's calculations from those records, so label them that way when you present them.
Choose your next move by what the X report told you
Your reading order leaves you in one of five places, and each one has a different next move.
- If the gap is volume, plan a cadence you can sustain in the X Post Planner.
- If the gap is per post, study the rival's Top 5 tweets by engagement and write your own version of the idea.
- If the gap is visibility, compare the posting-hour map with your audience's active times.
- If the gap is audience, review your inactive and bot-flagged followers with useful contacts protected.
- If the accounts come out level, stop chasing this rival and run the set again next month.
→ Start a competitor comparison on your Twitter account
Before you run it: FAQ on competitor comparisons
How do I find competitors on X if I don't know their handles yet?
Use Circleboom's Find Twitter Influencers to build a list of X accounts in your niche.
The Twitter Account Finder helps when you still need names.
Then test each one against the direct-peer criteria above before giving it a slot.
Can't I just compare us by looking at both profile pages?
Only for follower count, following count and recent posts. A profile page shows no bot share, no format mix and no per-post averages.
Our free Twitter X Metrics Calculator is the better quick read on one account.
Does my own X account use a Competitor Token in the comparison?
No, your own account on Circleboom never consumes a Competitor Token. Tokens are charged per competitor per report, so 4 rivals once costs 4 tokens and the same rivals on a 12-month schedule (13 reports) cost 52.
Does the X report show my competitor's profile visits or link clicks?
No. Profile visits, URL clicks and video retention curves are left out of every column on X, including yours, and your own analytics features cover them for your account.