

Exporting Twitter Ads data to Google Sheets in 2026 takes two passes: paid-campaign metrics come out of X Ads Manager as a CSV that imports directly into Sheets, and organic-content metrics ride on the official X content API and come out through Circleboom's analytics export as a parallel CSV.
Joining the two on the date column inside Sheets produces the unified reporting view most operators actually want when they search the phrase, because campaign performance only makes sense in context with the organic baseline.
Circleboom exports organic post analytics, follower analytics, and engagement breakdowns to CSV through Circleboom's verified Enterprise developer access. Pair it with Ads Manager's native CSV for the full Sheets reporting picture.
→ Open the X analytics workspace
Below: which export covers which metric, the exact Sheets workflow, and how to wire it into a recurring report.
Why Google Sheets Is the Right Reporting Surface
Three structural reasons explain why Google Sheets is the dominant Twitter Ads reporting surface in 2026.
The first is the cost gap. Looker, Tableau, and the higher-end BI tools cost $20 to $200 per seat per month. Sheets is free, the existing operator already has it, and the join-on-date workflow takes 15 minutes to set up.
The second is the freshness gap. Ads Manager's native dashboards do not let you join organic-post data with paid-campaign data inside the platform. Sheets is the lowest-friction surface where the join can actually happen. The article on exporting Twitter analytics covers the same join-side dynamic from a different angle.
The third is the reproducibility gap. CSV imported into Sheets is the same shape every run, which means the formulas, pivots, and downstream charts continue working as new data arrives. The article on exporting Twitter data and saving on Google Sheets covers the reproducibility side directly.
What the Two CSV Files Specifically Contain
The Ads Manager CSV contains spend, impressions, clicks, conversions, CTR, and CPM, broken out by date and campaign hierarchy. The export is paid-account-only, requires the operator to be logged into the Ads Manager directly, and does not include organic-post performance. The CSV is a one-time pull, not a connected feed.
The Circleboom analytics CSV contains engagement per tweet, click-through rate per post shape, follower growth, and audience composition. The data is current as of the last X API sync (usually within minutes), and the format is stable across runs. The article on how to export Twitter analytics covers the field-list side directly.
How to Export Twitter Ads Data to Google Sheets Step by Step
The combined workflow runs both methods, then joins the outputs into one Sheets reporting view. The recommended order is organic-data first, paid-data second, join third.
Hands-on demo: how the X analytics export workflow runs end to end.
The flow, in order.
Phase 1: Pull the organic baseline through Circleboom
- Log in to Circleboom Twitter and connect your X account through OAuth.

- Open the Followers / Following Management menu for the analytics workspace.
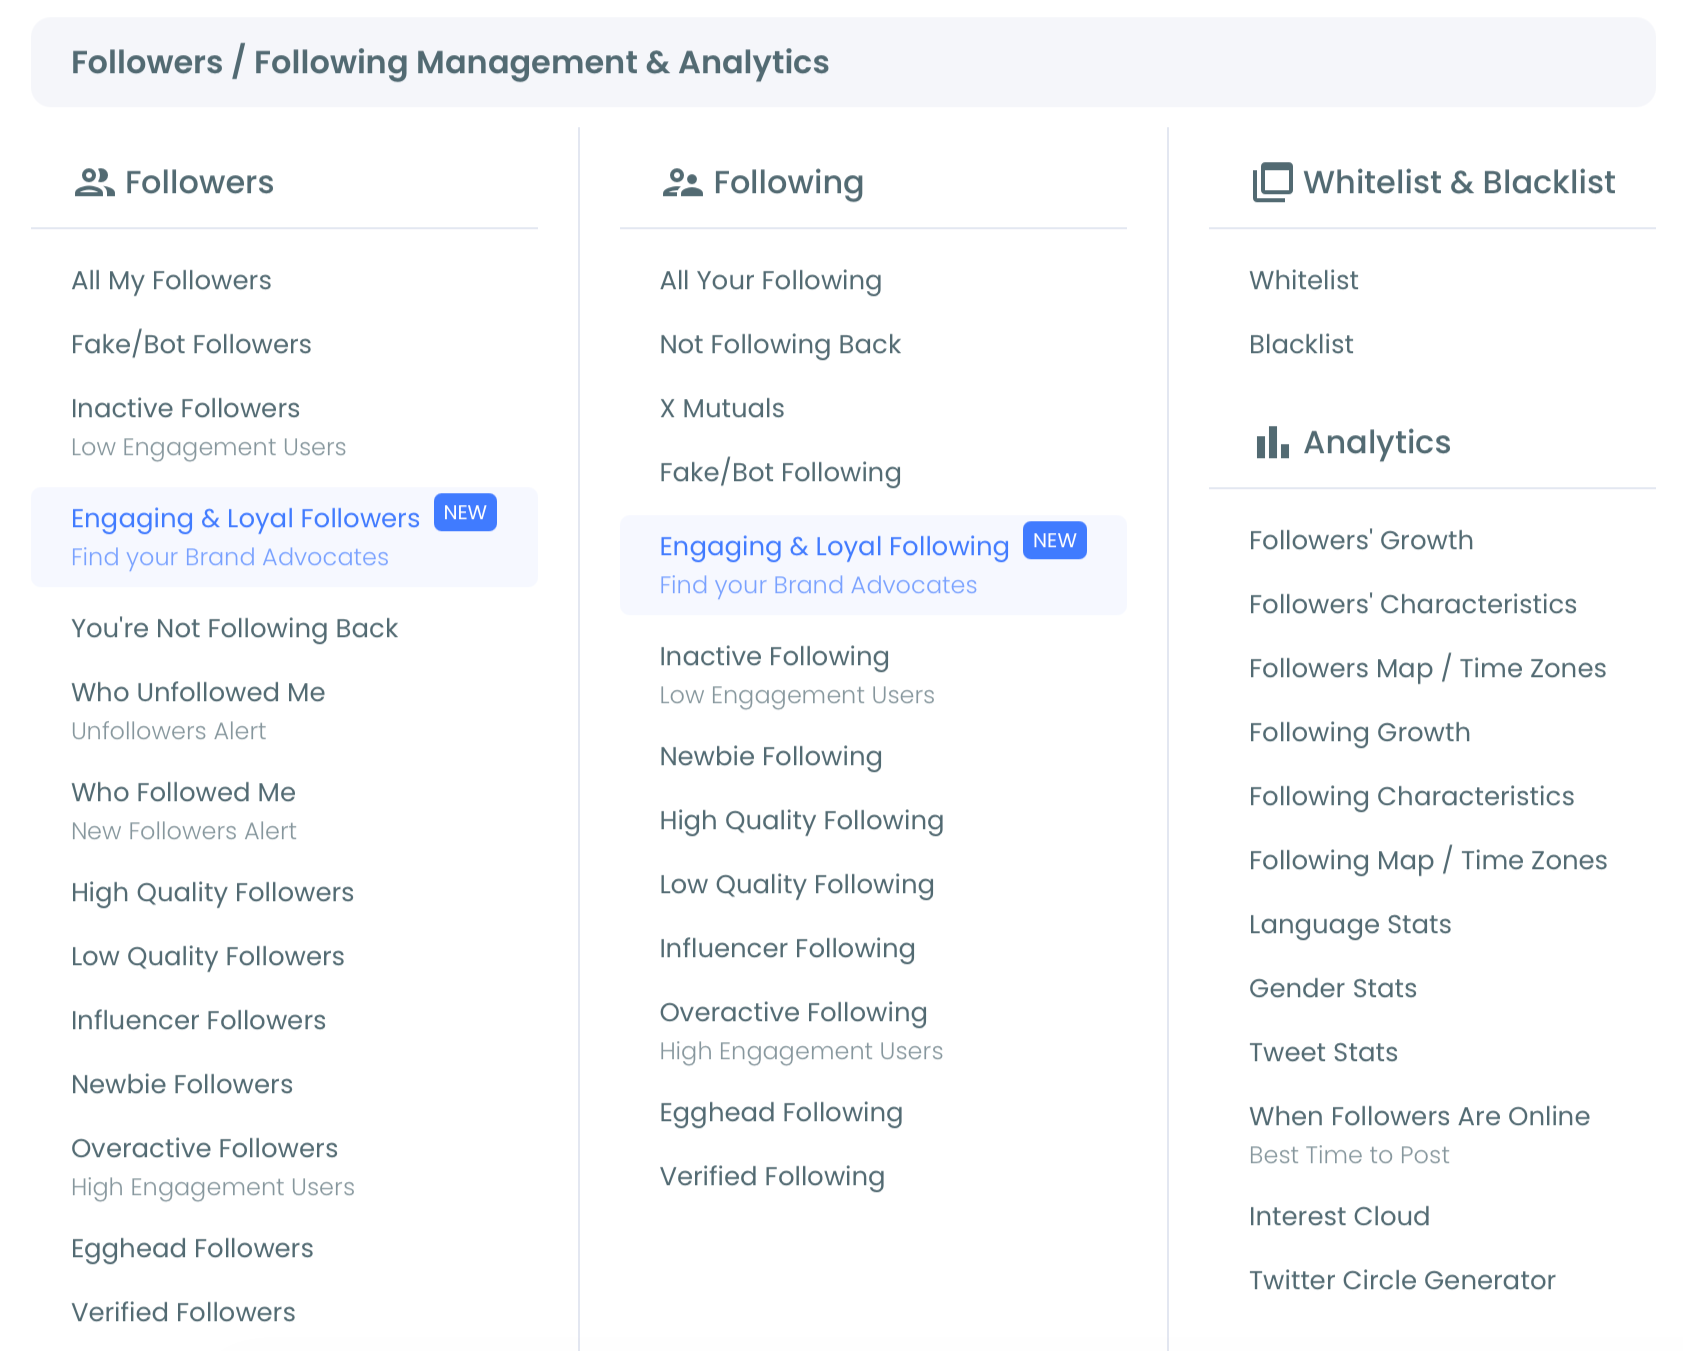
- Run the analytics export for the date range matching your campaign window. The output is a CSV with engagement, impressions, click-through rate, and follower-growth columns.
Phase 2: Pull the paid campaign data from X Ads Manager
- Open X Ads Manager in a separate tab and navigate to the campaigns dashboard.
- Select the campaign date range matching the Circleboom export and click Export to download the campaign CSV.
Phase 3: Import both CSVs into Sheets
- Open a new Google Sheets workbook with two tabs:
organicandpaid. - Use File → Import → Upload for each CSV into its corresponding tab.
Phase 4: Join on the date column
- Add a Combined tab with a VLOOKUP or QUERY formula that pulls from both tabs by date, producing a single row per date with paid plus organic metrics side by side.
That sequence produces the unified reporting view. The dashboard handles production, distribution, and the data layer; Sheets handles the join and the downstream charts.
What the Combined View Specifically Shows
The combined view answers the questions Ads Manager alone cannot.
The first is true ROAS. Paid campaigns produce conversions; some of those conversions also bring organic followers and engagement that compound on subsequent organic posts. The combined view captures the full lift, not just the campaign-window conversions.
The second is content-shape attribution. Some campaign creatives drive organic engagement weeks after the campaign window ends. The combined view shows which paid creatives produced lasting organic lift versus which produced campaign-window-only conversions.
The third is the audience-quality side. Paid acquisition often brings lower-quality followers than organic acquisition; the combined view surfaces the engagement-rate compression that pure ROAS calculations miss. The article on Twitter follower stats analytics covers the audience-quality reporting directly.
How to Wire the Workflow into a Recurring Report
A weekly recurring report runs three steps: pull the latest CSVs, append to the Sheets tabs, refresh the formulas. Most operators automate the first step with a simple Apps Script that pulls the Circleboom export weekly; Ads Manager exports remain manual because X does not provide a stable API endpoint for the report.
The article on how to export your Twitter data and save on Google Sheets covers the recurring-pull side directly.
What to Avoid in the Sheets Workflow
Three failure modes account for most reporting-pipeline collapses.
- Joining on tweet ID instead of date. Tweet IDs do not appear in Ads Manager exports for organic baselines, which means tweet-ID joins fail. Date joins are the reliable approach.
- Manually re-typing CSV data. The data is fresh out of the export; re-typing introduces errors and breaks reproducibility. Always import-as-CSV.
- Skipping the audience-quality dimension. Paid acquisition can compress engagement rate; reports that only show ROAS miss the compression effect. The article on exporting Twitter followers for hyper-targeted ads covers the audience-quality reporting angle.
How Circleboom Specifically Helps
Circleboom's analytics export covers the organic-side data that Ads Manager does not surface. The Followers segments, engagement breakdowns, and post-shape analytics all export to the same CSV format. The same Enterprise-tier access powers each layer, which means the Sheets workflow remains stable across runs.
The article on exporting tweets to Excel or CSV covers the broader export-format side.
The Bottom Line
Exporting Twitter Ads data to Google Sheets in 2026 is a two-CSV workflow: Ads Manager for paid, Circleboom for organic, joined on date inside Sheets. The combined view answers the ROAS, attribution, and audience-quality questions that single-source reporting cannot.
→ Open the analytics workspace now
Common Questions About Twitter Ads to Sheets
Can I automate the entire workflow?
Partially. The Circleboom side automates through Apps Script; the Ads Manager side requires manual export because X does not provide a stable API endpoint for the campaign report.
What is the difference between Twitter Ads CSV and Circleboom CSV?
The Ads Manager CSV covers paid-campaign metrics; the Circleboom CSV covers organic-content metrics. Both are needed for a full reporting picture; either alone misses half the data.
How long does the initial setup take?
About 30 to 45 minutes. The recurring weekly run takes 5 to 10 minutes once the formulas are in place.
Is the workflow safe under X's rules?
Yes. All exports run through Circleboom's Enterprise developer access on X. No scraping, no browser scripts, no automation outside platform policy.

