

X's own recommendation documentation puts the daily volume at roughly 500 million posts, filtered down to the handful that reach any single For You timeline.
Your tweet is not competing for a reader's attention first. It is competing for a slot in a ranking system that already decided how much reach to hand you before a single person read a word.
That ordering matters, because it means attention fails in two different places, and the fix for one makes the other worse.
What this walkthrough gives you.A two-number test that tells you whether your tweets are losing attention at distribution or at conversion.The sort order that ranks your whole accessible tweet history by the signal you actually care about.A weekly loop that turns your best-performing tweets into the next ones you write.
Circleboom ranks every tweet on your X account by impressions, likes, replies, and engagement rate through official X Enterprise APIs, so a year of posting sorts itself in one click.
→ improve tweet attention
Why X tweets lose attention in two completely different places
Attention on X is two separate transactions, and most advice treats them as one.
The first transaction is distribution: the ranking system decides how many timelines your tweet enters. The second is conversion: of the people who saw it, how many stopped scrolling and did something.
A tweet can pass the first and fail the second. It can also do the reverse.
The generic advice stack (better hooks, more visuals, three hashtags, post at 9 AM) mixes remedies for both problems into one list and hands it to you without telling you which problem you have.
That is why the advice feels like it works for other people. They had the failure it happens to fix.
X gives you the numbers but not the ranking
X gives you the raw numbers for both halves. The activity dashboard reports impressions and engagements per tweet, one tweet at a time.
What it does not do is rank your whole history by either number. That ranking is the step that turns two metrics into a diagnosis, and doing it by hand across a few hundred tweets is a lost afternoon nobody has.
Circleboom's X engagement analytics sorts every accessible tweet on your X account into one ranked table, so the ordering costs a click instead of an evening.
The same ordering problem shows up when you study someone else's account instead of your own. Reading a competitor's numbers is a different job with different tooling, which is the distinction Twitter analytics for another account is built around.
How to improve tweet attention with Circleboom, step by step
Building that ranking is a short job, and it belongs before any of the reading that follows, because you cannot interpret an order you have not produced yet.
Video walkthrough: how the per-tweet table re-ranks a full year of posts the moment you change the sort column.
https://www.youtube.com/watch?v=GzGW70aSZqE
The process, in order.
Pull the ranked table before you write anything new
- Log in to Circleboom Twitter, then approve the standard X OAuth prompt.

- Open the X Post Planner menu, which is where the per-tweet numbers and the drafting tools share a screen.
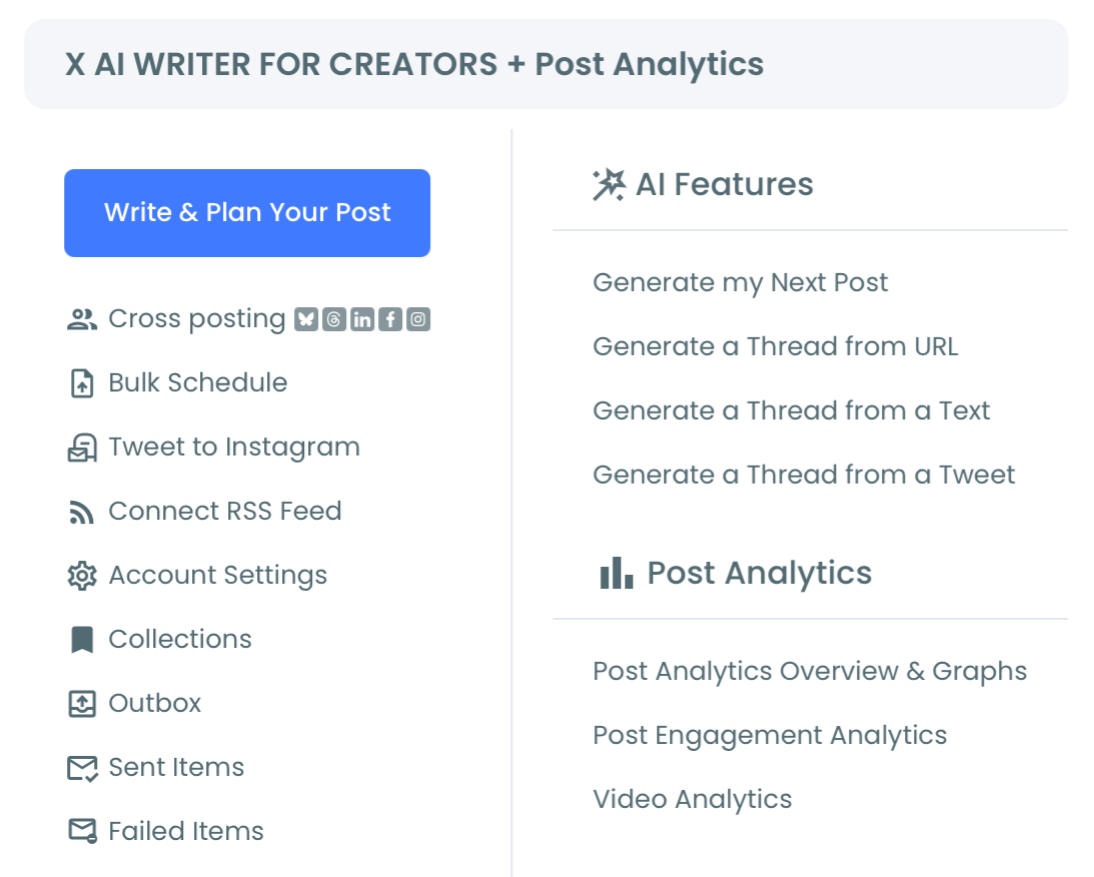
- Sort the tweet table by impressions, then re-sort the same table by engagement rate, and note every tweet that ranks near the top of both orders.
- Apply the date filter to the last 90 days so a single old spike does not distort what the current audience responds to.
Turn the ranking into your next tweet
- Filter by media type and by keyword to test which formats and which topics carry attention on your account specifically.
- Send the top performers back into production with Rewrite with AI for a fresh angle, or add them to the reshare queue for a second distribution window.
Run it in that sequence and every stage retires a guess the next one would otherwise inherit. The double sort separates reach failure from message failure, the filters isolate the variable, and only then does anything get written.
Reverse the order and you are editing hooks in the dark.
Quick recap:
- Connect the account and open the analytics table.
- Sort twice, by impressions and by engagement rate.
- Filter by date, media type, and keyword.
- Reshare or rewrite what already ranked.
The rankings age, and that is the detail almost everyone forgets. The audience that produced last quarter's top ten is not the audience reading you now, so a stale snapshot quietly recommends the wrong topics.
Rerun the sort on a schedule. Finding your own X account analytics is only worth the click if the numbers describe the account you have today.
The two numbers that separate reach failure from message failure
Step 3 leaves you holding two orders of the same table, and reading them against each other is the whole diagnostic. Engagement rate is engagements divided by impressions, the same definition X uses in its advertising glossary, so the two columns describe opposite ends of the same event.
Four positions are possible, and each one points at a different fix.
| Where the tweet lands | What it means | What to change |
|---|---|---|
| High impressions, low engagement | Reach arrived, the message did not convert it | Opening line, format, specificity |
| Low impressions, high engagement | The message works, distribution is the bottleneck | Timing, cadence, replies, resharing |
| Low impressions, low engagement | Wrong topic for this audience | Topic selection, audience fit |
| High impressions, high engagement | Your working template | Repeat it, expand it, reschedule it |
Most accounts chasing attention are fixing quadrant one while living in quadrant two. They rewrite hooks that were never the problem, because nobody told them their message already converts at a healthy rate on a tiny base.
When a tweet sits between two quadrants
Not every tweet sits cleanly in a corner, and the ones near the middle are the ones to skip. A quadrant reading only holds when a tweet sits clearly above or clearly below your own median on both axes. Find those two medians first, and treat the middle band as unresolved rather than forcing it into a diagnosis.
Twenty ranked tweets are usually enough for the corners to appear. Five are not, and reading corners into five rows is how a single unusual week becomes a content strategy.
Add media type as the third axis
The media-type filter splits the same table again. Filter to image tweets and read the median engagement rate, then filter to plain text and read it again.
The gap between those two numbers is the honest version of the general claim that visual content types change engagement. Measured on your account, that claim is either true for you or it is not, and the answer takes about ninety seconds.
A question about format is easier to settle at the format level than tweet by tweet. That is the view Twitter content performance analysis is built to give you.
One warning on reading the ranking. Engagement rate divides by impressions, so a tweet that reached 80 people and collected four replies posts a rate that beats everything else you wrote this year.
Read rate and absolute numbers together, or you will build a content plan on a rounding error.
What the quadrant test cannot tell you about your X audience
The table ranks what you published. It says nothing about what you never published.
That blind spot matters for the third quadrant, the one where impressions and engagement rate are both low. A weak hook explains a single flat tweet. It does not explain a flat quarter.
When a whole run of tweets lands in that corner, the likelier cause is topic fit: you are writing about something your audience is not interested in from you.
Circleboom's Interest Cloud comes at that question from the opposite direction, by reading what your followers publish and showing the terms that keep reappearing across the whole audience.
Put that view beside your top-ranked tweets and one of two things happens. Either the recurring terms match the topics that already earn attention, which confirms the lane you are in, or they name subjects you have barely touched.
A well-written tweet about a topic your audience does not care about loses to an average tweet about one they do. That is the uncomfortable finding the two tools produce together, and no amount of hook editing changes it.
Settle topic fit before you touch craft
There is a sequencing rule hiding in that. Fix the topic first, because a craft fix applied to the wrong topic produces a better tweet that still nobody wanted.
Treat the result as a content brief drawn from your own followers rather than a trend report. It ages the same way the rankings do, so rerun it after any growth spike or cleanup that changes who is actually reading you.
What measured attention changes about your X posting
The imagined reader goes first. The ranked table names the topics, formats, and openings that already earned attention from the people following you now.
That list is almost never the one you would have written from memory.
The second change is cheaper experiments. When you know your median engagement rate, a new format becomes a testable claim rather than a mood, and you can retire it after four tweets instead of four months.
The third is that paid and organic stop contradicting each other. Accounts that never audit organic attention tend to buy their way past the diagnosis instead of fixing it.
That habit gets expensive fast, and the hidden cost of cheap reach on X Ads is where the bill shows up. Reach you paid for still has to convert, and the conversion half is exactly what the organic ranking measures.
When the diagnosis points at distribution rather than message, the fix usually lives in scheduling. That is where best posting times on Twitter earns its place in the loop.
Why these X numbers can be trusted
Circleboom sits inside this loop as a verified Enterprise partner of X. The per-tweet figures match what X reports rather than approximating them from scraped pages.
That matters more than it sounds. A diagnostic is only as good as its inputs, and your account is never exposed to an unofficial workaround just to produce a chart.
Run the cycle weekly and the account starts to improve tweet attention on X inside the hours you already spend. The gain comes from deciding better rather than publishing more.
Is it safe to run this analysis on your X account?
Yes, because nothing in the diagnostic writes to your account. Sorting, filtering, and reading a table are read operations against data X already publishes to you about your own tweets.
The two actions that do touch your account, resharing and scheduling a rewrite, each need an explicit click from you, and a scheduled item cannot be set to publish the same minute you create it. Nothing auto-posts, and no AI rewrite goes live without your approval.
The practical risk with attention work is not account safety. It is acting on a ranking you misread. That is why the engagement-rate caveat above is worth rereading before you delete anything or change your whole format on the strength of one high-rate row.
Your next three moves on X
The diagnostic is worth running once this week, then once a month after that.
- Sort your tweet table by impressions and by engagement rate, and write down the ten tweets that rank high in both.
- Filter the same table by media type to see which format your audience actually stops for.
- Queue two of your top performers for a second distribution window instead of writing two new tweets from scratch.
Do those three and you will have replaced the generic attention checklist with an account-specific one. That is the whole difference between advice that worked for someone else and a decision grounded in your own numbers.
→ see which tweets earn attention
What people ask
How many tweets can I actually analyze?
The table covers your 3,200 most recent posts. That ceiling is set by the platform for a standard account rather than by Circleboom, and at a few posts a week it stretches back several years.
Why is engagement rate missing on some of my older tweets?
Engagement rate needs an impression figure to divide by. Where X never supplied one for a row, the table shows the raw like and reply counts and leaves the rate blank instead of estimating it.
Does deleting weak tweets improve tweet attention on future ones?
Deleting a low-performing tweet does not retroactively change how the ranking system reads your next one. Fixing the topic and format mismatch that produced the weak tweet does, which is what the sorted table is for.
How often should I rerun the sort?
Every two to four weeks is enough for most accounts, and always after a growth spike or a follower cleanup. A ranking built on a different audience composition tells you what used to work.
Which sort should I trust when the two orders disagree?
Neither one alone. A tweet that ranks high on impressions and low on rate is a message problem, and one that ranks high on rate but low on impressions is a distribution problem. The disagreement between the two orders is the diagnosis, not a contradiction you need to resolve.

