
Impressions are the metric people check most on X and understand least. X reports the number under an individual post and keeps a rolling recent summary of the last 28 days. What it will not do is rank your whole history by reach, or explain why some of your posts carry no impression figure at all.
Both gaps have the same fix. Both also have limits worth knowing before you start.
You can see Twitter impressions for every post in your accessible history inside Circleboom's Post Analytics table, where impressions sit as their own column and any column can rank the whole table from highest to lowest. Circleboom reads that column from X's Enterprise API rather than from a scrape, so the figures are the ones X reports.
→ see Twitter impressions
The column is not always full, and the blanks tell you something useful.
How to see Twitter impressions across your accessible post history
Five steps, and the fifth is the one most people skip.
Connect the account whose posts you want to measure
- Log in to Circleboom Twitter with the X account that published the posts you want to rank.

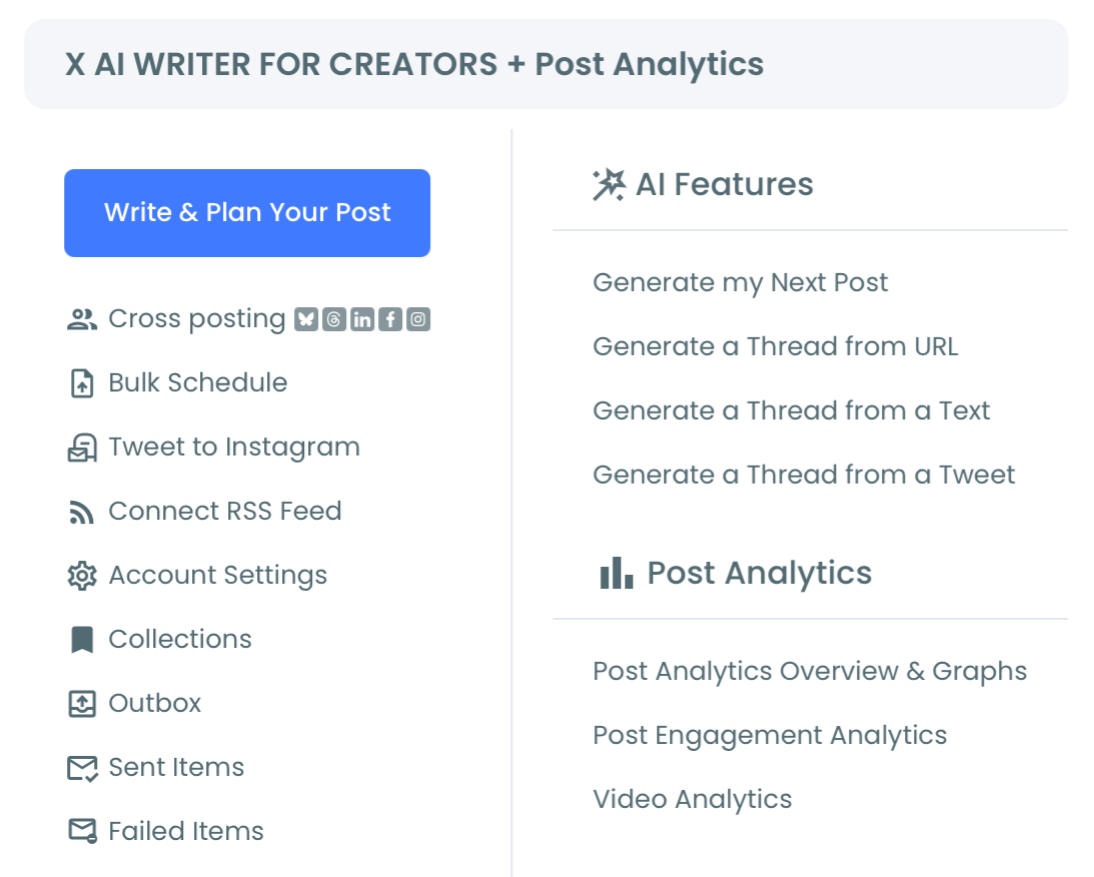
- Pick Post Analytics out of the X Post Planner menu.
Rank the table by reach instead of by date
- Order the table by impressions, largest first, so the widest-reaching posts rise above the most recent ones.
- Narrow the visible set with the filters the table offers: date range, post type, language, keyword, media type, or a minimum engagement threshold.
Read the rows that came back without a number
- Scan for rows where the impression cell is empty, and note that engagement rate will not display for those posts either, since Circleboom divides engagements by impressions to produce it.
That order matters because a sort is only as honest as the data underneath it. Ranking first and reading the blanks second stops you from crowning a post as your widest-reaching when the row above it simply has no number to compare against.
Quick recap:
- Authorize the account whose posts you are measuring.
- Open Post Analytics under X Post Planner.
- Order the table by impressions, largest first.
- Filter by date, post type, language, keyword, or media.
- Read the empty cells before you rank anything.
On video: the same sorted impression view, produced without an X Premium subscription.
https://www.youtube.com/watch?v=tAXZ5hamLVY
Why X's own impression numbers stop short
X shows you impressions one post at a time, and that is the constraint everything else follows from.
Click a post and you get its figure. Open the recent summary and you get a rolling window.
Neither view lets you take your full published history and order it by reach, so the question "which of my posts reached the most people, ever" has no native answer.
Doing it by hand is not a workflow. On an account with a few hundred posts you would be opening each one, writing the number down, and comparing manually. On an account with a few thousand it stops being possible at all.
That is the specific hole a ranked table fills. It is not more data than X has, it is the same data put in an order X does not offer.
Why do some posts show impressions and others show nothing?
Impression data can genuinely be missing for a post, and Circleboom shows the gap rather than filling it with an estimate.
Two documented cases produce an empty cell. Impression and analytics data may be unavailable for tweets posted before the account connected to Circleboom. It may also be unavailable for tweets that sit outside X's own analytics retention window.
When a row has no impression figure, there is nothing to divide by, so its engagement rate stays blank as well. The two columns empty out together.
That is worth saying plainly rather than burying it in a footnote. Coverage varies by account, and on an older account a meaningful slice of the table can come back with no impression figures at all.
An absent value and a genuine zero look similar at a glance and mean opposite things. A zero says nobody saw the post. A blank says the number was never available to report.
So treat the populated rows as your comparison set and set the rest aside. That is exactly what a descending sort on view your Twitter impressions hands you when you read it from the top down.
If the blanks are widespread on your account, the account-side causes are worked through in why you can't see your tweet analytics.
What an impression actually counts on X
An impression is a display, not a reader.
It is logged wherever the post was displayed, whether that was a timeline, a set of search results, or a notification. Passive exposure is in the count, and so is an autoplay scroll-past where nobody stopped. A high impression count does not indicate active engagement, and reading it as approval is the most common mistake in this whole metric family.
X's own metrics definitions put it the same way. The figure counts screen appearances, and it is not deduplicated by person, so one reader who sees a post twice adds two to it.
This is why impressions and likes answer different questions, and why the relationship between them confuses people. For that specific distinction, do likes count as impressions on Twitter works through it properly.
What the impression column does not tell you on its own
Engagement rate is impressions doing double duty, and that changes how you read it.
The rate is a ratio: total engagements over impressions. A post that reached almost nobody but collected three replies can therefore show a very high engagement rate. The figure is arithmetically correct and close to meaningless at scale.
Read the rate and the absolute numbers in the same glance, never the rate alone.
The other columns exist for that reason. Alongside impressions the table carries engagements and the rate itself, replies and reposts, likes, video views and starts, profile clicks, and URL clicks. Together they tell you whether reach turned into anything at all.
When the question is what people did rather than how many saw it, engagement analytics is the view built for it. The metric-by-metric tour in tweet activity and Twitter analytics metrics maps how the signals differ from each other.
Circleboom is an official X Enterprise Developer company. These figures therefore arrive through an authorized connection to your own account rather than through a workaround, which is why connecting is a routine authorization rather than a risk you take on the account.
Start there when you want Twitter impression analytics rather than one post's number at a time.
What to do with the posts at the top of the list
The ranked view is not read-only, which is the part most people miss.
Once the widest-reaching posts are sitting at the top, you can act on any of them without leaving the table. From a selected row you can:
- Queue the post for a reshare in a different distribution window.
- Set auto-retweet on it for recurring repost cycles.
- Send it to the X Post Planner for a later publishing slot.
- Rewrite it with AI in the composer before reposting.
- Open it to read the full text and media before deciding anything.
Two rules keep that useful rather than noisy:
- Anything you reschedule or reshare needs to sit 15 minutes ahead or more, on an account that is still authenticated when it fires.
- AI rewrites are drafts. Nothing goes live until you read one and choose to schedule or post it yourself.
The point of ranking by impressions is that it produces a shortlist worth acting on. A post that reached widely once is a reasonable candidate to reach widely again, which is a very different claim from "this post was good."
When impressions are high and nothing else moved
A post with a big impression number and flat everything else is a diagnosis, not a disappointment.
Engagement is not one metric. Likes, replies, reposts, bookmarks, profile clicks, and link clicks each signal a different kind of response, and a post can win one while losing the others.
A post with few likes may still drive clicks. A post with heavy reach may create no conversation at all.
So the useful comparison is intent against outcome. Judge a link post by URL clicks, a discussion post by replies, and a reach play by impressions. Judging all three by the same column is how people conclude their content is failing when it is simply being measured against the wrong goal.
Reach without response usually means the post was seen by the wrong people, not that it was a bad post.
That is the moment to look at who is seeing it rather than how many. High impressions with weak profile clicks points at audience fit; high impressions with weak URL clicks points at the hook or the link placement.
How to read impressions over time without fooling yourself
Impression figures are a snapshot, not a live feed.
Circleboom retrieves the metrics at the moment the data loads, and each one reflects whatever X was reporting right then.
A post published an hour ago is still accumulating views. Its number will keep climbing after you look at it, and what you saw will lag until the next refresh.
Two habits follow from that:
- Compare posts of similar age, not a week-old post against this morning's.
- Re-sort after a refresh before you draw a conclusion about anything recent.
Neither habit is exotic. Both stop the most common misreading, which is treating a fresh post's early number as its final one.
There is a third habit that matters more than either. Write down the number you are comparing against before you look, because an impression figure only means something next to a baseline.
Your own median post is a better baseline than your best one.
A single outlier at the top of the sort makes every ordinary post look like a failure. Most accounts have at least one post that reached far past its normal band for reasons that had nothing to do with the writing.
Over a longer horizon the useful comparison is period against period rather than post against post. The account-level view in X post analytics is the right home for that question.
And if you want one figure across everything you published, total impressions on Twitter explains what that total can and cannot mean.
The number worth watching, and the one worth ignoring
An impression column with honest blanks in it is more useful than a full column of guesses.
That is the whole argument. X gives you the per-post figure and a recent summary. A ranked table gives you the order, the comparison, and a visible mark where the data does not exist.
Once you can sort your history by reach and tell a real zero from an absent value, impressions stop being a vanity number and start being a diagnostic one.
→ Pull the ranked view and see impressions on X for every post you can still reach.
Reader questions about the impression column
Can I see Twitter impressions for someone else's account?
No. Post Analytics reads the history of the X account you connect and authorize, so the table only ever holds your own posts. Public counts like likes and reposts are visible on anybody's posts, but the ranked impression column here is scoped to the account you connected.
How far back do impressions go?
Circleboom works on the accessible tweet history, which the X API caps at 3,200 posts for a standard connection. Older material sits beyond that ceiling however many years the account has been publishing. Inside the window, impression coverage can still be partial for the reasons above.
Do my replies and reposts appear in the impression table?
Yes. The table covers the posts the API returns for your connected account rather than original posts only, and post type is one of the filters you can narrow by. If you only want to read reach on original content, filter to it before you rank the column.