

How do you track tweet views for a campaign when X shows them one post at a time? You set the campaign's exact dates as a custom range, read the totals for that window, and then rank the posts inside it.
The tricky step comes afterwards: the dashboard compares your campaign with the weeks right before it, not with last quarter's launch.
What this walkthrough covers.
- Setting a custom date range that matches the campaign to the day.
- Reading views, engagements and clicks against the equal period before launch.
- Ranking the campaign's posts by impressions and checking which ones drew clicks.
Circleboom charts tweet views for any date range on your X account and reads every number through X Enterprise API access that X itself approved. Set your window here → track tweet views for your campaign dates.
Why campaign tweet views need their own date range
A campaign has a start and an end, but each post on X shows only its own view count. A ten-post campaign means ten separate numbers to add by hand.
Preset ranges only half fix that. A 4-week window that opens before launch day mixes pre-campaign posts into the total, and a 7-day window cuts off the tail of a longer push.
Circleboom's Post Analytics totals tweet views, engagements and clicks on X for any dates you pick, which is the piece a campaign report needs. A dashboard built to measure tweet views for exact campaign dates turns ten counts into one total and one comparison.
Campaign weeks carry one quirk worth knowing before you report. X counts the author's own looks and repeat looks as views, and during launch week a team may open its own posts again and again to check replies.
I note that in every campaign report, so nobody reads the view total as a head count.
Campaign reporting is one use of a wider habit, judging posts by what they achieved. For that habit across the whole account, read Twitter content performance analysis.
Set the campaign window before you open the dashboard
A campaign read can go wrong before any number appears, when the dates are chosen after the results are visible. Have these in hand first:
- The first and last day of the campaign, fixed before you look at any totals.
- A read date, since campaign posts keep collecting views after the last one goes out.
- The metric that counts as a view for this campaign: Impressions for text and image posts, or Video View Count when the campaign was built on video.
- An account that was already connected to Circleboom when the campaign ran.
Deciding whether teaser posts belong to the campaign
When a launch opens with teasers a few days before the main push, decide up front whether they count. If they do, the range starts on the first teaser; if not, it starts on launch day and the teasers fall into the comparison period instead.
That choice moves both sides of the percentage on every card, so write it into the report. A reader who sees a strong lift deserves to know whether the teasers sat inside the campaign or inside its baseline.
If the team has not agreed on which numbers the campaign will be judged on, settle that first with Twitter key performance metrics.
Dates picked after seeing the numbers let the campaign grade its own work.
How to track tweet views for a campaign in Circleboom, step by step
Circleboom's Post Analytics does the job in two layers: an overview that charts any two metrics across a custom date range, and a post-level table that ranks each tweet inside the same dates. You can open a campaign tweet views dashboard.
Eight steps, grouped into three phases, cover the whole read.
Open the analytics overview on your connected account
- Log in to Circleboom Twitter, making sure the connected X account is the one that ran the campaign.

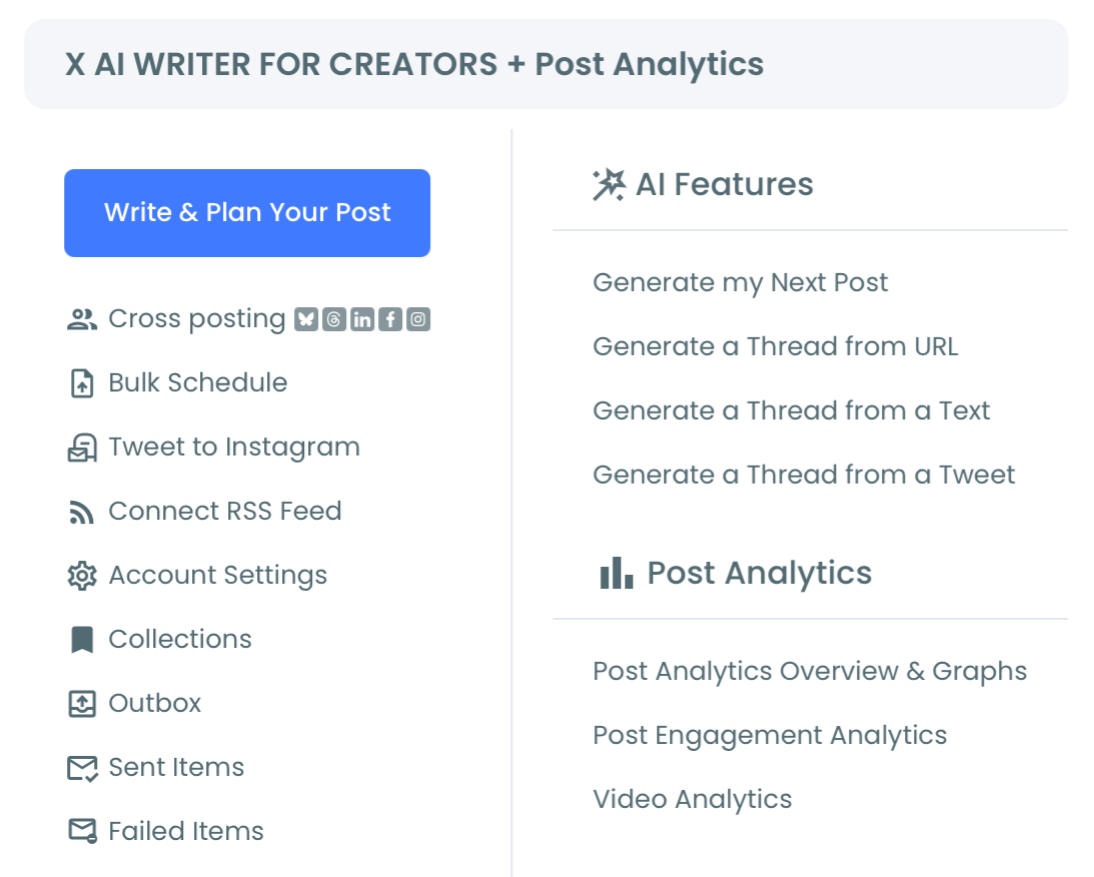
- Pick X Post Planner from the Circleboom menu, the section that holds Post Analytics.
-
Choose Post Analytics, and the overview opens on its default 4W range.
Fit the chart to the campaign window
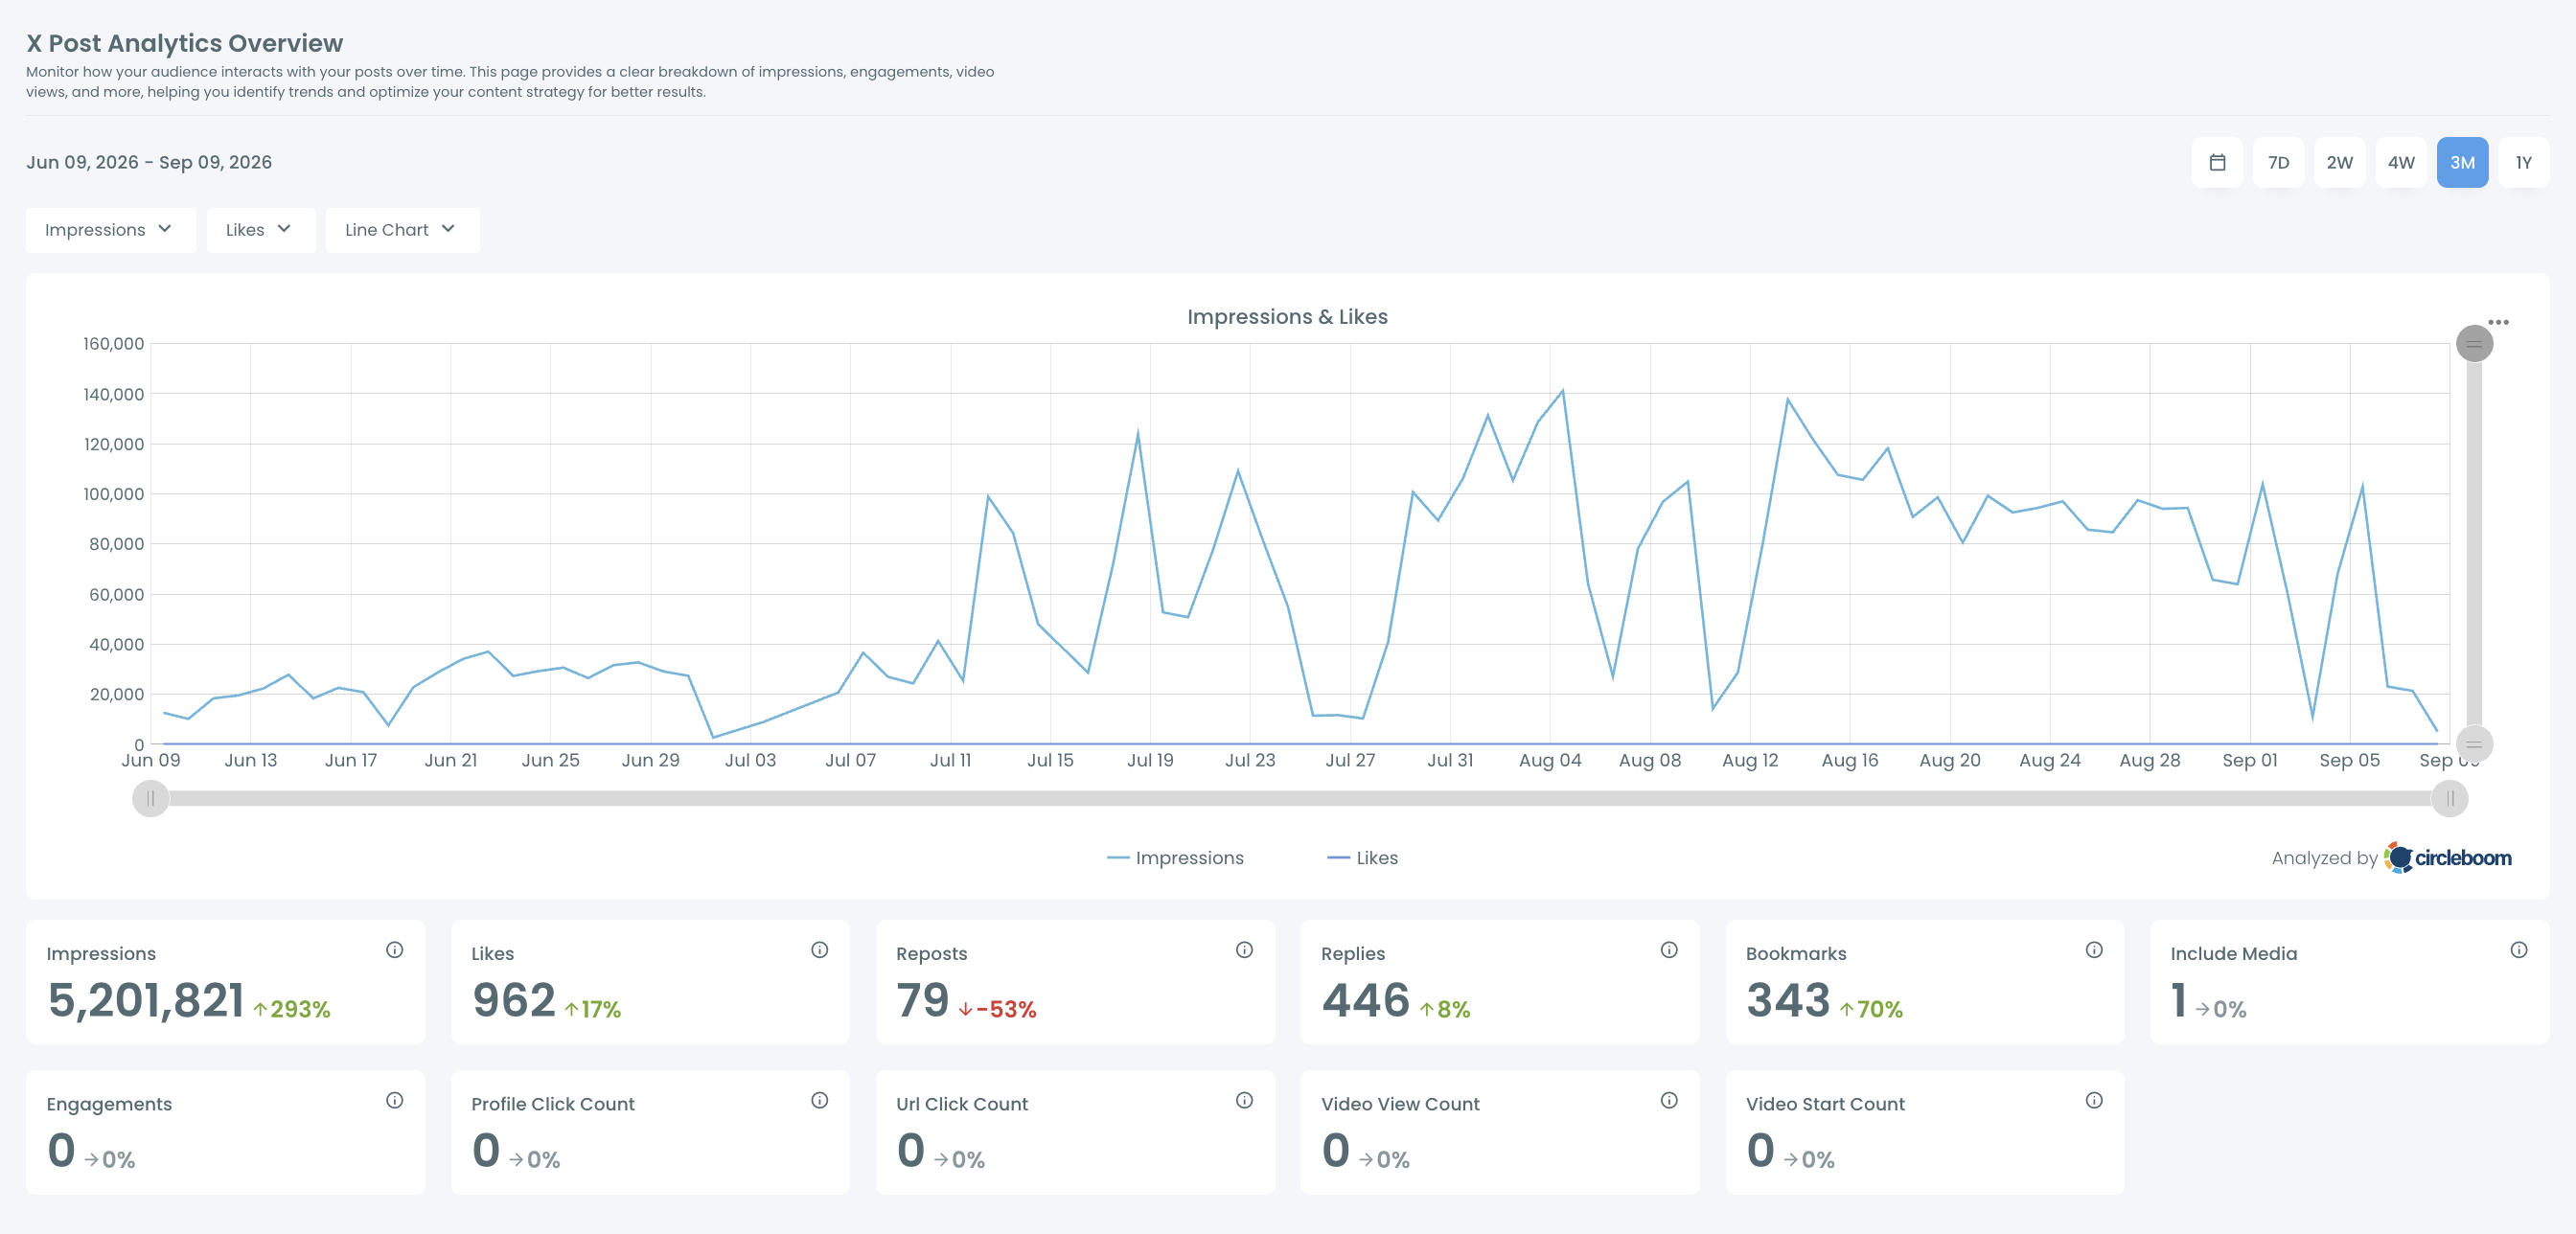
- Click the calendar icon beside the range presets and pick the campaign's first and last day.
- Pick Impressions in one Insights dropdown and Engagements in the other; a video campaign swaps Engagements for Video View Count.
- Check the cards below the chart for each campaign total and its percentage against the equal stretch before launch.
Find the posts that carried the campaign
-
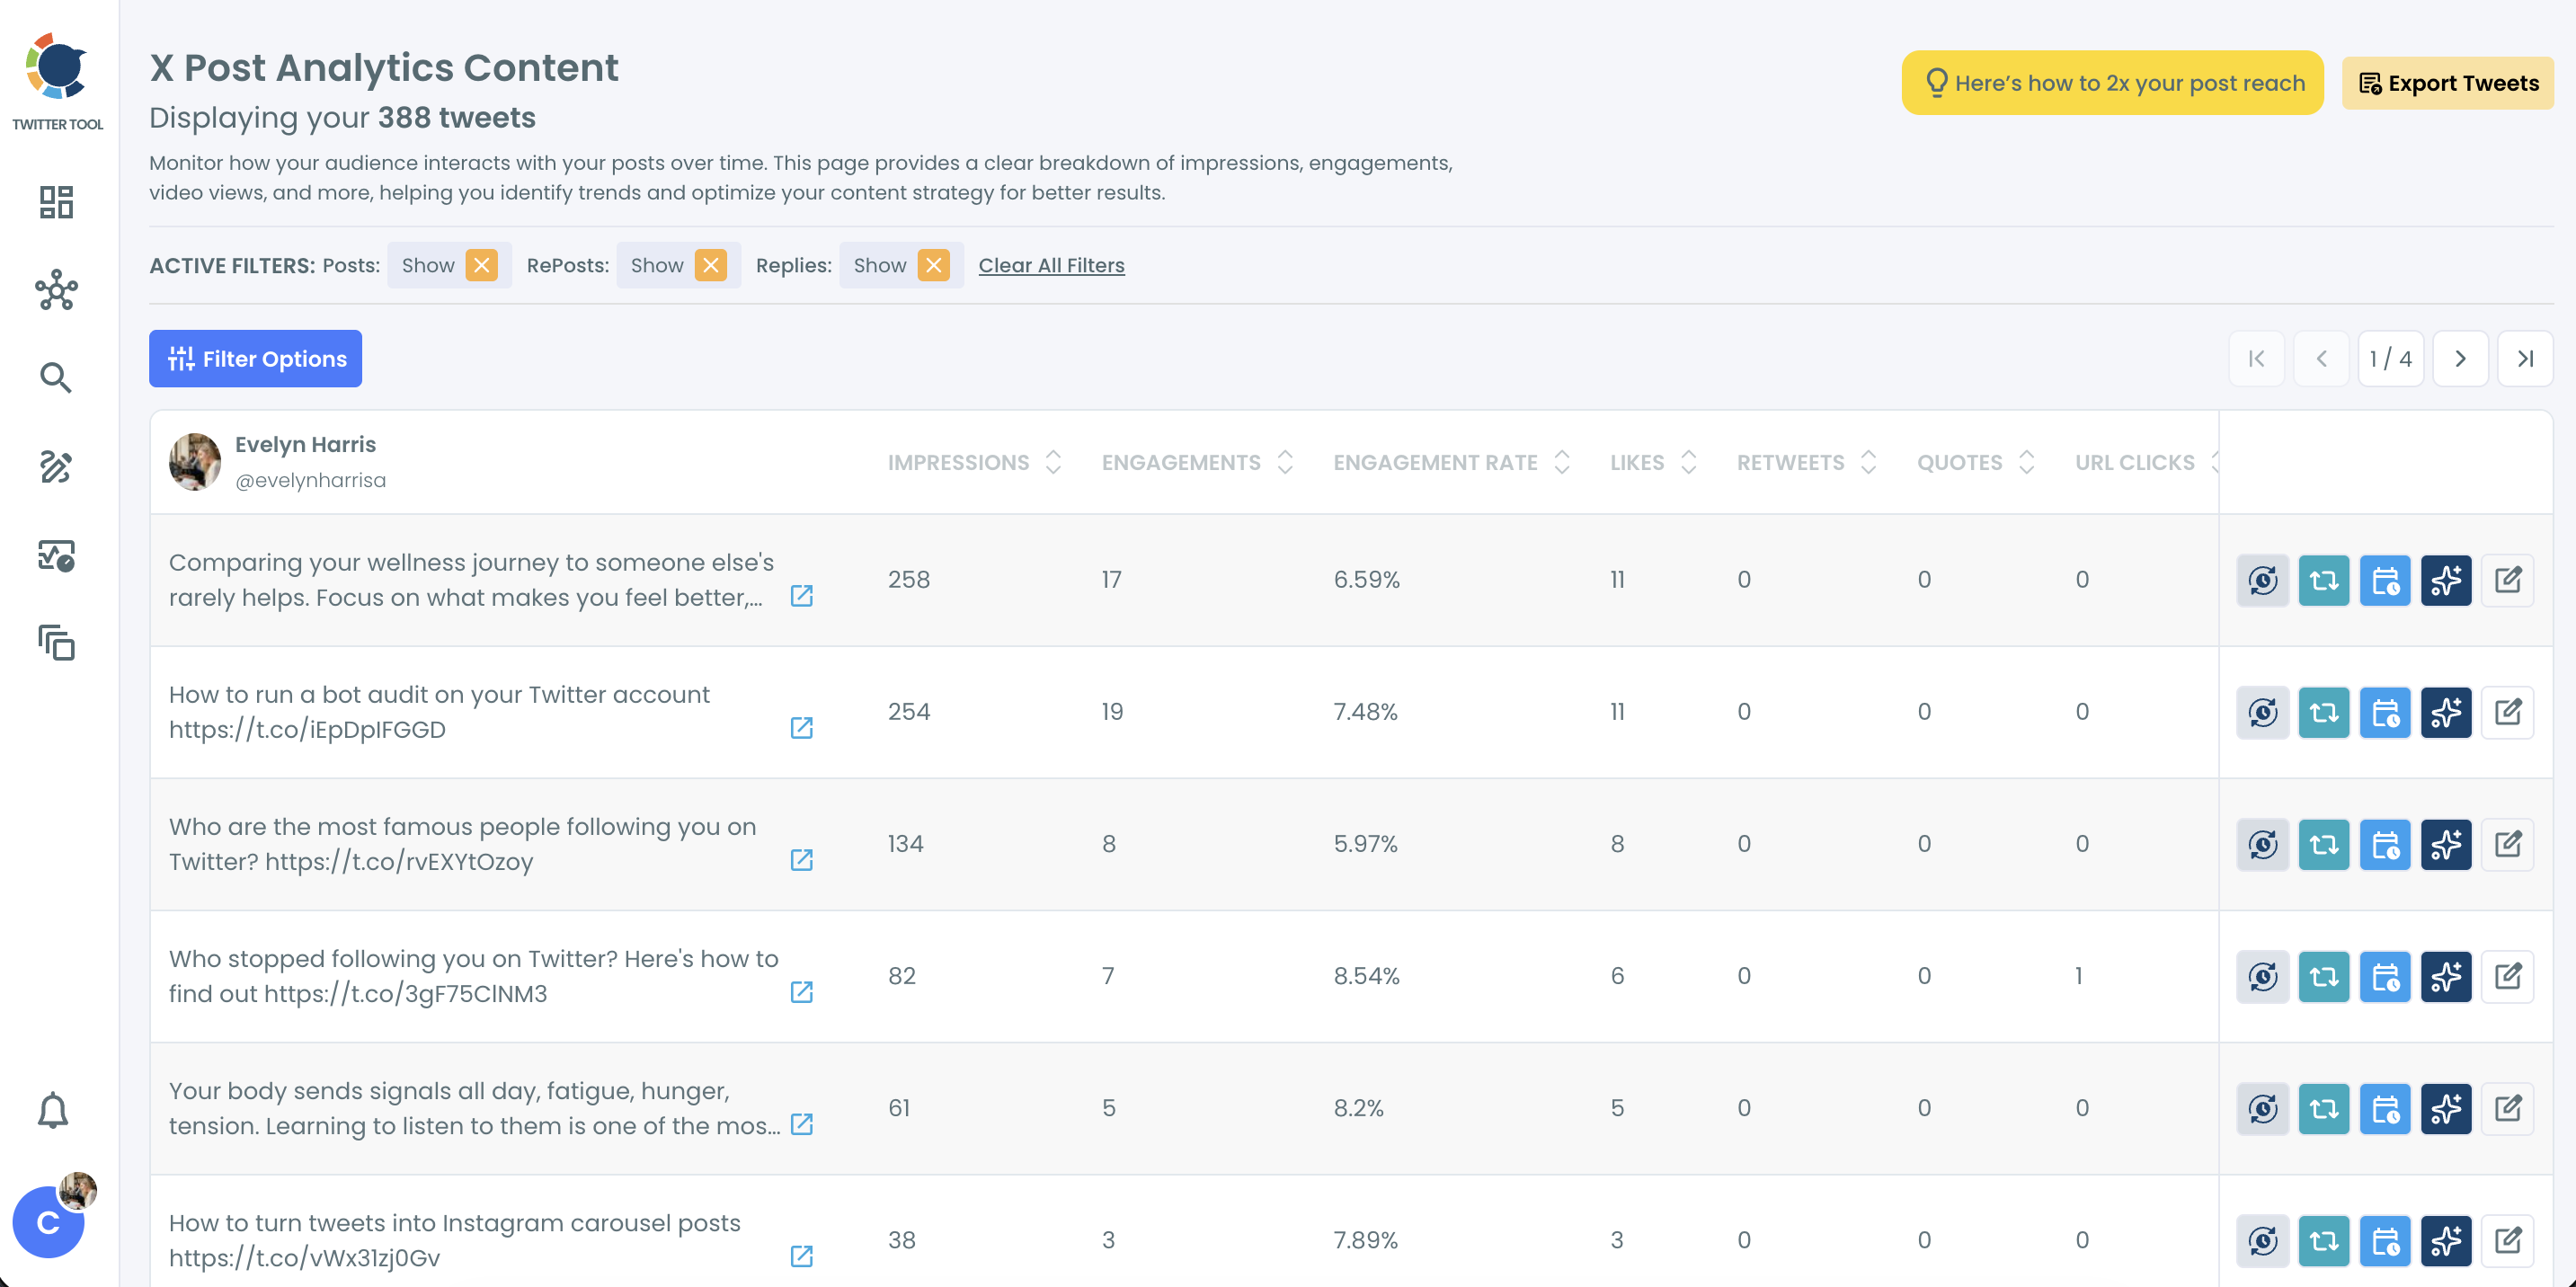
Switch to the post-level table, apply the same dates in its date filter, and sort by impressions.
-
Note the profile clicks and URL clicks for the top posts before you write anything down.
The range comes first because every card and every percentage depends on it. The post table comes last because it explains the totals the overview just gave you, and starting there invites a report built around one loud post.
The post-level table is the part of Twitter post analytics that ranks single tweets. Besides impressions, it ranks tweets by video views, URL clicks, profile clicks or engagement rate, so the same dates can be read from several angles.
Reading a campaign day by day on the X analytics chart
The chart shows where inside the campaign the views arrived, which the card totals cannot. Two controls help here:
- Set the chart type dropdown to Bar Chart, so each day of the campaign gets its own bar.
- Drag the scroll slider under the chart to pan across a long window without changing the dates.
A launch-day spike followed by a flat line reads differently from steady daily bars, even when both add up to the same total. The first pattern lived on one moment; the second kept finding readers.
The Include Media card adds a quick check for mixed campaigns. It counts the posts in the window that carried media, so you can confirm how many image or video posts went out before crediting them with the result.
Keep the two Insights metrics related to each other. Impressions beside Engagements shows whether reach and response moved together, while a random pair tells you little.
Can you compare this campaign with an earlier one?
Not inside the overview. Its percentage changes always compare the selected dates with the period of equal length right before them, and the view has no setting for picking another baseline.
That default suits one question: did the campaign lift the account above its normal level? It cannot answer the next question, which is whether this launch beat the last one.
The workaround takes two passes. Run the overview once for each campaign's dates, record the card totals, and set the two windows side by side in your report.
For post-by-post comparisons, the post table's date filter does the same job one window at a time.
| What you want to compare | Where to read it | What to watch |
|---|---|---|
| The campaign against the weeks just before it | Overview cards and their % change | Teasers inside the baseline move the % |
| This campaign against an earlier campaign | Overview totals, run once per window | Record both before you compare |
| Single posts inside or across campaigns | Post table with its date filter | Older campaigns can fall outside the table |
Comparing campaigns of different lengths
Two campaigns often run for different numbers of days, so raw totals favor the longer one. Dividing each total by its days puts them on one scale.
An illustrative example: a 14-day campaign with 42,000 views averaged 3,000 views a day, and a 10-day campaign with 35,000 views averaged 3,500. The shorter campaign had the smaller total and the stronger pace.
Read the percentage and the total together. An illustrative case: a card showing +80% sounds strong, but if the period before launch held 2,000 views, the campaign window reached 3,600.
That lift is real, and it is also small next to a campaign that added 20,000 views at +25%.
Timing can also split two campaigns. If one ran its posts at hours when followers were offline, the comparison measures scheduling as much as content.
Check when your followers are online with best time to post on Twitter before blaming the content.
Why a campaign window can come back empty or short
An empty or thin campaign window can come from a data limit rather than from the campaign itself. Three limits are documented:
- X returns analytics only within its own retention window, so a campaign from long ago may show zero or partial metrics.
- The post table works on the most recent 3,200 tweets, so a busy account's older campaign can fall outside it.
- Posts from before the account's Circleboom connection can lack impression figures.
A fourth cause is simpler. The numbers are read when the page loads, so a campaign that is still running looks smaller than it will be; refresh before the final read.
If you are not sure where X keeps its own figures, start with finding your X account analytics.
When X's own page is the part that fails, read Twitter analytics not working.
An analytics fallback on screen: reading the same post numbers in Circleboom when X's page will not load.
Saving campaign totals before they fade
The retention limit has a practical consequence: the numbers a campaign shows today will not stay available forever. The report you write this month may be the only complete record you ever get.
So record the totals soon after each campaign closes. Write down the card values, the read date and the top posts from the table while every number is still available.
If the team keeps post-level data outside the dashboard, Circleboom's Export Tweets feature can save it for reports and audits.
That record is also what makes the earlier comparison possible. Next quarter's campaign can only be measured against this one if this one's numbers still exist somewhere.
What a campaign report on tweet views should include
A campaign report needs the view total, the engagement that came with it, and the clicks that followed, each for the same dates. Views alone describe reach, and a report that stops there leaves out whether the reach did anything.
X's help page on the tweet activity dashboard gives the engagement rate formula, engagements over impressions, and Circleboom works it out the same way for each post. The benchmarks I use for X: good starts at 0.5% and runs to 0.8%, very good covers 0.8% through 1.5%, and excellent begins above 1.5%.
A report I trust carries five lines:
- The campaign dates and the date the numbers were read.
- Total impressions, or Video View Count for a video campaign.
- Total engagements and the engagement rate they produce.
- Profile clicks and URL clicks for the whole window.
- The top posts by impressions, with their clicks beside them.
For a longer list of what to watch between campaigns, read key Twitter performance metrics for tracking success.
The totals tell you whether the campaign moved the account; the post rows tell you which posts to build the next one on.
Your campaign tweet views checklist
Each campaign read runs on the same five moves:
- Fix the campaign dates and a read date before launch.
- Set the custom range and chart Impressions with Engagements, or Video View Count for video.
- Write down each card's total and its percentage against the pre-launch window.
- Rank the posts by impressions for the same dates and note their clicks.
- Keep the totals, so the next campaign has a baseline to beat.
A campaign report is only as honest as the dates chosen before anyone saw the numbers.
→ Track tweet views for your next campaign window
FAQ on campaign tweet views in X
Where do link clicks from a campaign show up in Circleboom?
In the Url Click Count card for the campaign dates, and in the URL clicks column of the post table. Read them beside impressions, since they are separate counts and a large view total says nothing about clicks until you check.
Should a video campaign report video starts or video views?
Report both, and lead with Video View Count. Under X's rule, a video view needs 2 seconds or more of playback while 50% or more of the player is visible, per its guide to Media Studio analytics.
A start only means playback began. For clips the campaign reshared from other accounts, see impressions on shared videos.
Why does a one-week campaign show such large percentage swings?
Short ranges compare small samples. One strong post in the campaign week, or in the week before it, can produce a large percentage change on a 7-day read, so longer windows give steadier comparisons.

