

The platform shows you the current follower number and nothing else. You cannot see how it got there, which days it moved, or what caused any of the movement. Tracking follower growth on Twitter requires a historical layer the app does not provide.
Circleboom records your follower count daily and renders the result as a growth chart with paired daily gain-and-loss bars, so you can see trend lines, spikes, and drops over time. The data comes from sanctioned API access, indexed by date, and is exportable for deeper analysis.
→ Track Twitter follower growth
Keep reading for the full setup, the view-switching logic, and what the data actually tells you once it has built up.
Why Twitter Does Not Show You Your Own Growth Curve
Twitter has never shipped a native follower-growth chart for personal accounts. The native analytics surfaces are tuned toward post engagement, not audience evolution, and even when they do show follower numbers, the historical depth is shallow and the granularity is rough.
The gap is structural. To see growth you need two things the app never gives you: a record of follower counts indexed by date, and a daily-change view that breaks the cumulative line into actual gain-and-loss bars. Without the dated layer, the only signal you have is the difference between what you remember the number being last week and what it shows today, which is unreliable enough to make every growth conversation a guess.
The cost of that gap is decisional. Most of the questions worth answering about audience growth (which campaign actually moved the number, whether the new posting cadence is working, whether the topic shift is converting or shrinking the base) are unanswerable without dated data. The follower number sitting on your profile cannot tell you any of those things. The follower-growth-stats page closes the gap by recording the count daily and showing you what the line actually did.
How to Track Twitter Follower Growth With Circleboom
Three actions, one of them ongoing. The chart populates as data accumulates, so the earlier you start the snapshot loop, the more usable history you have to work with when you actually need it.
Connect your X account to Circleboom
- Log in to Circleboom Twitter and authorize your X account with official OAuth. The growth-tracking record begins at this moment.

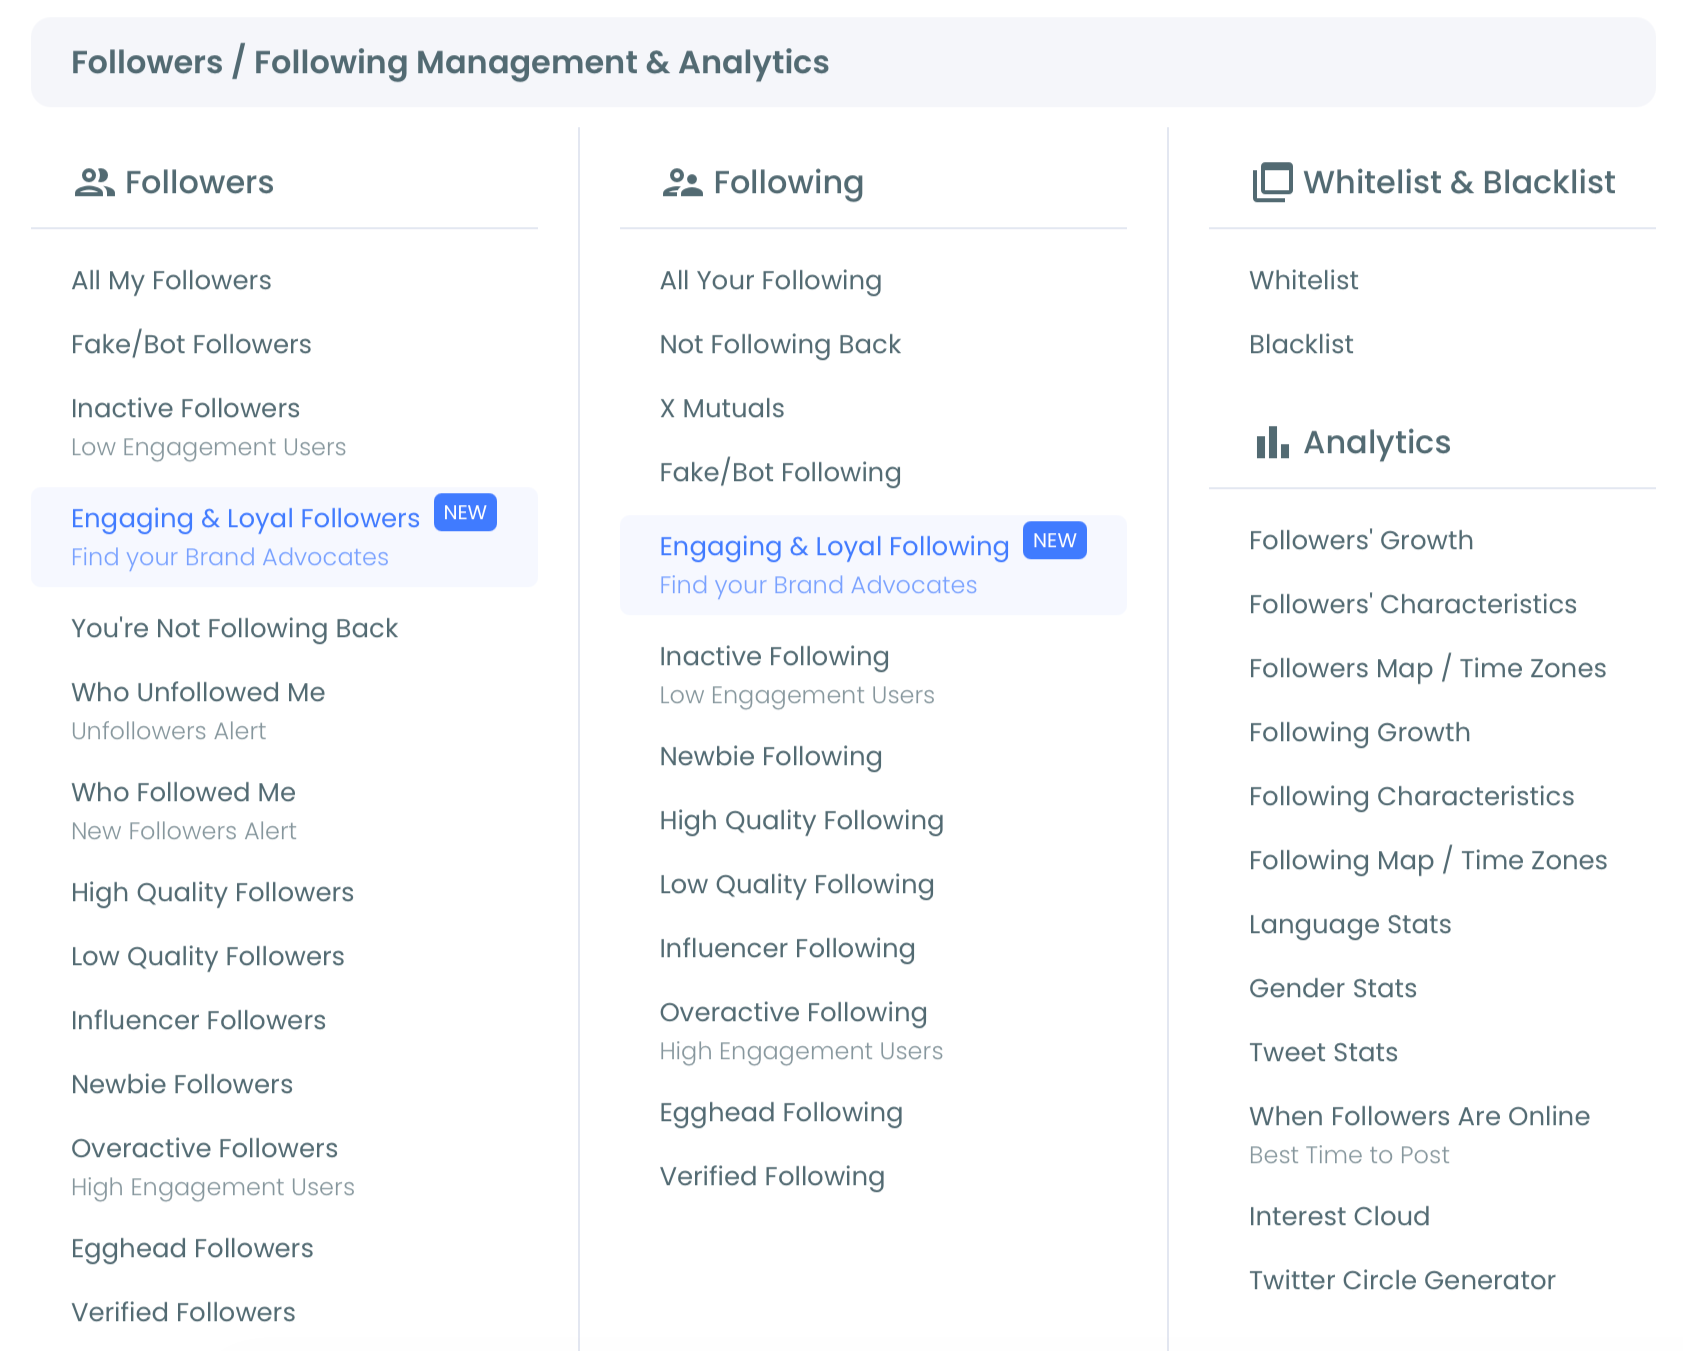
Open the Follower / Following Management menu
- Open the Follower / Following Management and Analytics menu from the left sidebar and look for the Followers' Growth section under the analytics group.
Switch between Performance View and Daily Change View
- Use Performance View to read the cumulative growth curve over weeks or months. Switch to Daily Change View to see the individual gain-and-loss bars that produced the curve. The two views answer different questions: the curve shows whether the strategy is working, the bars show which specific days it worked or did not.
Compare growth windows against your posting log
- Cross-reference the chart against the dates you posted heavier content, ran campaigns, or shifted topics. That correlation is the part most operators skip, and it is the part that turns the chart into an actual strategy input rather than a passive metric.
That sequence is why the workflow holds up. The login earns sanctioned API access, the menu loads the right analytics surface, the view-switching covers both the macro trend and the micro events, and the correlation step turns growth data into decisions. Skip the correlation and the chart is just a line.
Video walkthrough: how the daily-gain-and-loss chart renders for a real account that finally started attributing growth to specific posts.
What Tracking Twitter Follower Growth Actually Tells You
The first useful thing the chart shows is whether the line is trending the direction you assumed it was. Most accounts with a steady-feeling number are actually losing on some days and gaining on others, and the Daily Change View makes that hidden churn visible. Whether the trade is net positive over a 30-day window is a question only the daily bars can answer.
The second useful thing is event attribution. A spike on a date you posted a thread that landed well, or a drop on a date you ran a campaign that did not, both show up in the bars. That attribution is invisible without the dated layer, which means every content decision before you had it was being made on intuition.
The third useful thing is comparison. You can see whether the slow weeks were genuinely slow or whether they were just weeks where you posted less. That distinction matters because it separates content-quality problems from cadence problems, and those two problems have completely different fixes.
Circleboom is an official X Enterprise Developer company, so the snapshot cadence runs against X's published platform limits with no scraping involved. The same dashboard surfaces a broader Twitter follower stats view and the underlying Twitter follower tracker so you can switch between cumulative and per-account views in one place.
DataReportal's social media baseline puts the scale problem in context: at typical X account growth rates, manually noting daily follower counts in a spreadsheet is not viable for sustained periods. The automated workflow is the only one that produces enough history to be useful.
When you are ready to set this up, Circleboom's follower growth dashboard is the page that handles the snapshot loop, the chart rendering, and the view switching in one place.
Related Circleboom reading that goes deeper on the adjacent threads:
- Twitter follower tracker covers the per-account tracking layer that complements the growth chart.
- Twitter follower count tracker on the cumulative count side of the data.
- how to track Twitter followers for the broader tracking-method overview.
- free way to track Twitter follower growth over time addresses the budget question directly.
FAQ
Does Twitter show follower growth over time natively?
Not in any usable form. Native analytics surfaces show post engagement primarily, with shallow follower-count history and no daily-gain-and-loss view. The data you need to actually track growth has to come from a tool that records it on a schedule.
How long until the growth chart becomes useful?
A few weeks of data is enough to start seeing weekly trends. A month gives you enough to spot real patterns. Three months of accumulated history is where the chart becomes genuinely strategic because you can compare across multiple posting cycles.
Can I track follower growth on multiple X accounts?
Yes. Circleboom supports multiple connected X accounts under one workspace, and the follower growth chart renders per account so you can compare growth curves across them or focus on one at a time.
What if my follower count dropped on a day I did not do anything?
Platform-side cleanup of suspended or deleted accounts can produce drops you cannot trace to your own activity. The Daily Change View helps separate those mechanical drops from drops correlated to specific posts, because mechanical cleanups tend to be small and isolated, while content-driven drops tend to cluster on specific dates.
Can I export the growth data?
Yes. The dashboard supports CSV export of the underlying daily-count series, which is the format most operators use for cross-tool analysis or quarterly reporting.
The Pattern That Pays Off
The single most useful habit is the weekly review of the Daily Change View. Not the cumulative line, because the cumulative line averages everything out and hides the data points that actually inform decisions.
The bars are where the answers live. A week of green bars on days you posted long-form content tells you something. A week of red bars on days you posted reactive replies tells you something else. The trend line cannot show you that. The dated bars can.
The first month of data is the hardest to start because the chart looks empty. The third month is where the chart starts paying back, because you finally have enough history to read patterns instead of single events. The fix for the empty-chart feeling is to start the snapshot loop today and forget about it for a month, which is exactly what the follower growth tracker is built to do.


