

A Twitter impressions checker tells you how many times your posts appeared on someone's screen, and the useful ones tell you whether that number is climbing or sliding. The raw count is trivia. The direction is the decision.
Impressions, read as a trend instead of a single number.Total impressions for every tweet across any window from 7 days to a full year.Reach measured against the previous period, with a clear percentage shift up or down.Impressions paired with engagements, so you see whether views turned into action.
Circleboom runs a Twitter impressions checker for X built on official, authorized API access. Open the impression dashboard and read the direction, not just the count.
What a Twitter impressions checker actually measures
An impression is a single instance of your post appearing on a screen. It is not unique, so the same person seeing the same tweet twice counts twice, per X's own explanation of view counts. That matters because impressions measure distribution, not applause.
A tweet with 40,000 impressions and nine likes was shown widely and ignored widely. The number tells you how far the post traveled, not how well it landed once it got there.
Most people first meet this figure inside the native dashboard, where X gates the deeper analytics view behind a paid tier. A dedicated checker pulls the same distribution data and puts it in front of you without that paywall.
A good checker also holds more than one metric at once. Circleboom reads eleven of them for your connected account, and the ones that matter most for reach are simple to name:
- Impressions: how many times your posts were seen.
- Engagements: total interactions across likes, replies, reposts, and clicks.
- Bookmarks: quiet saves that signal lasting value.
- Profile clicks: how often reach turned into curiosity about you.
- Video views: reach for video, which behaves differently from text.
That single dashboard turns a scattered pile of per-tweet counts into one readable picture you can act on. If you have only ever glanced at one tweet's number, it helps to first understand whether likes count as impressions, because the two get confused constantly.
What impressions do not tell you
Impressions are a starting point, not a verdict. On their own they cannot tell you who saw the post, whether the audience was the right one, or whether anyone did anything afterward. A high number with no engagement usually means the algorithm pushed you to people who had no reason to care.
That is why a checker worth using never shows impressions in isolation. It shows them next to the actions that followed, so reach and response sit in the same view.
Reach is the question, not the answer. What people did next is the answer.
If you suspect your posts reach the wrong crowd, the fix starts with reading the full metric set rather than one figure. The key Twitter performance metrics worth tracking map out which numbers actually change a decision.
The number is not the answer, the trend is
Here is the gap most impressions guides never close. They teach you how to find one tweet's count, then stop. A single count answers "how did this post do." It cannot answer the question that shapes your strategy: is my account getting more reach over time, or less?
Only an aggregated trend answers that. Looking at three months of impressions side by side tells you whether performance is rising, flattening, or quietly bleeding out. That is a different question with a different answer than any single tweet gives you.
The trend view also protects you from a common misread. On a short seven-day window, one viral tweet can inflate your percentage change into something that looks like a breakthrough when the base period was simply quiet.
Longer windows of four weeks or three months smooth that noise into a signal you can trust. Read the direction first, and read individual tweets second.
If your reach ever falls off a cliff, the trend is also where you diagnose why your Twitter impressions suddenly dropped instead of guessing.
A full history also beats a single glance. You can see your total impressions on X across every post you have ever sent, which is the only way to learn your true baseline.
The trend is where a checker earns its keep. You do not check your Twitter impressions to admire one number; you check it to read a line.
How to check your Twitter impressions
Checking impressions the trend way takes four moves, and none of them require X Premium.
1. Log in to Circleboom Twitter and connect your X account through official OAuth.

- Open the X Post Planner menu and go to Post Analytics.
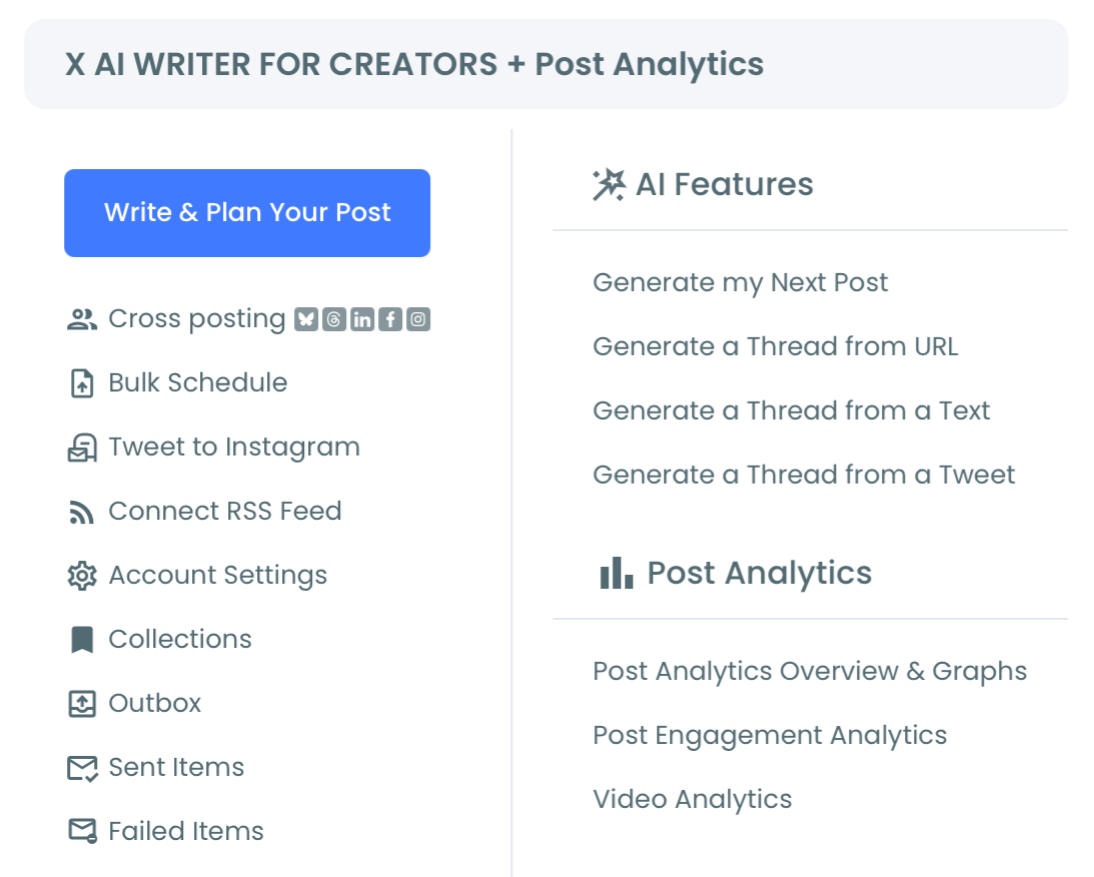
3. Choose Impressions in the Insights dropdown and set a time range, from the seven-day preset up to a full year or a custom window.
4. Read the summary card and the trend line together. The card shows total impressions plus the percentage change against the previous equal period; the chart shows the shape of that change over time.
That order works because the login earns authorized data first, the metric selection scopes what you are measuring, and the range decides whether you are reading noise or a real pattern. Skip the range step and a single spike will fool you every time.
See it in motion: how impressions and engagements render as overlapping trend lines in one Circleboom view.
If you want the fuller picture, this same flow lets you check Twitter analytics without Premium for every metric, not impressions alone.
Reading impressions together with engagements
Impressions on their own describe volume. Impressions next to engagements describe quality. A checker that plots both at once lets you ask the sharper question: when reach went up, did interaction follow, or did you just get scrolled past more?
Circleboom overlays two metrics on the same chart, so you watch impressions and engagements move against each other across the same dates. When the lines climb together, your content is landing. When impressions rise but engagements stay flat, you are getting distribution without resonance, and the fix is the message, not the reach.
- Rising impressions and rising engagements: the content is working, do more of it.
- Rising impressions, flat engagements: you are seen but skipped, sharpen the hook.
- Falling impressions across a long window: a distribution problem, check timing and consistency.
Distribution without engagement is a warning, not a win.
The math makes this concrete. If a post earns 40,000 impressions at a 0.4% engagement rate, that is roughly 160 interactions from a very wide reach. Push the same 40,000 impressions to a 3% rate and you get about 1,200. Same distribution, wildly different result, and only the paired view shows you which one you are living in.
For the raw side of that calculation, the Twitter X Metrics Calculator works out reach and engagement rates for any public account.
Put both lines on one chart yourself the moment you open your Twitter impression analytics, and the quality question answers itself.
Comparing reach before and after a change
The single most useful thing a checker does is settle an argument you would otherwise have with your gut. Did that new posting schedule actually help, or did it just feel like it?
Select the window before your change, then the window of equal length after it, and read whether the trend line moved. The before-and-after comparison is the most direct measurement of whether a decision moved the needle, because it removes memory and mood from the judgment.
A creator who shifts from three posts a week to daily can see, inside one screen, whether the extra volume bought more total reach or just more work. The Engagement Analytics view then breaks the winning period down per tweet, so the lesson is specific rather than vague.
Impressions checker versus the native X dashboard
The native X dashboard and a dedicated checker answer different questions. The built-in view is fine for a quick look at one recent post, but it locks its richer history and comparison tools behind X Premium, and it shows each tweet in isolation.
A checker is built for the opposite job. It assumes you care about the pattern across dozens or hundreds of posts. So it defaults to the aggregate trend, keeps the full metric history in one place, and lets you compare any two windows side by side without a subscription.
The practical difference shows up the moment you ask a strategy question. The native view can tell you a tweet got 12,000 impressions. It cannot easily tell you whether 12,000 sits above or below your three-month average, whether reach is trending up, or whether last month's schedule change helped.
Those are the questions that actually change what you post next. A number without a baseline is just a number.
There is also the matter of scope. A checker reads reach for every post at once and charts it, while the native tab expects you to open tweets one at a time. For anyone posting more than occasionally, that gap is the difference between a habit you can keep and a chore you abandon.
Neither view invents data; both read the same underlying metrics. The checker simply organizes them for decisions instead of for glances, which is the entire reason it earns a place in your routine.
Why official access matters for the number you trust
An impressions checker is only as honest as the data behind it. Circleboom is an official X Enterprise Developer company, so the impression figures you read come straight from X's authorized data pipeline rather than from scraping or guesswork. Your account stays compliant, and the numbers stay complete.
That completeness is the point. Scraped tools miss data, break when X changes, and put your login at risk. Authorized access returns the full metric set X actually recorded, which is what makes a trend worth reading in the first place.
Numbers you cannot trust are worse than no numbers, because they steer real decisions the wrong way. When you want raw figures for a report, you can also see your tweet analytics and export them cleanly.
Your next move
Impressions checking gets valuable the moment you stop treating it as a scoreboard and start treating it as a compass. Run the loop and read the direction.
- Connect your account and open Post Analytics.
- Set a four-week range for a stable read, not seven days.
- Overlay impressions with engagements to judge reach quality.
- Compare a before-and-after window whenever you change your strategy.
A checker that shows one number tells you what happened. A checker that shows the trend tells you what to do next.
→ Run your Twitter impressions checker
Common questions about checking Twitter impressions
Can I check my Twitter impressions without X Premium?
Yes. Because Circleboom pulls impression data through authorized X API access, you can read reach for every post without a Premium subscription, including full historical trends the native free view no longer shows.
How far back can I see my impressions?
You can select windows from seven days up to a full year, or a custom range. Very old tweets may return partial values because X limits how long it serves historical analytics through its API, which is a platform limit rather than a tool gap.
Why does my impressions percentage change look so extreme?
Short time ranges exaggerate change. A single strong tweet in a quiet seven-day window can produce a large percentage swing. Switch to a four-week or three-month range for a stable comparison before you act on it.
Do impressions and views mean the same thing on X?
Effectively yes. X's view count and the impressions metric both count the times a post appeared on a screen, non-uniquely. Engagements, likes, and profile visits are separate metrics that measure what people did after seeing it.
Can I check impressions for accounts I do not own?
No. Impression data is private to the account owner, so a checker only reads impressions for the X account you connect and authorize. For public accounts you can still analyze visible engagement, but not their private impression counts.



%20account)