

Understanding how your content performs on Twitter is crucial for improving engagement, growing your audience, and refining your social media strategy.
Analytics provide the data you need to see what’s working, what’s not, and where you can improve.
When I started analyzing my Twitter account, I noticed that some tweets performed well while others barely gained traction. This made me realize the importance of understanding audience behavior and optimizing my strategy.
Twitter’s built-in analytics were helpful but limited, and you can't use it without a premium account.
That’s when I turned to a better tool, Circleboom Twitter, which provided detailed insights that transformed my approach.
You can view analytics on Twitter and check the most accurate statistics about your content, audience and profile without Premium!

Let’s explore how you can check Twitter analytics and why using tools like Circleboom Twitter might be a better option.
You can view posts and user analytics on Twitter, desktop, and mobile without Premium!
 Fuat Zarifoglu
Why Are Twitter Analytics Important?
Tracking analytics on Twitter offers several key benefits:
🟢 Understand Content Performance: Analyze and learn which tweets resonate most with your audience.
🟤 Track Engagement: Measure likes, retweets, replies, and impressions to gauge audience interest and engagement rate.
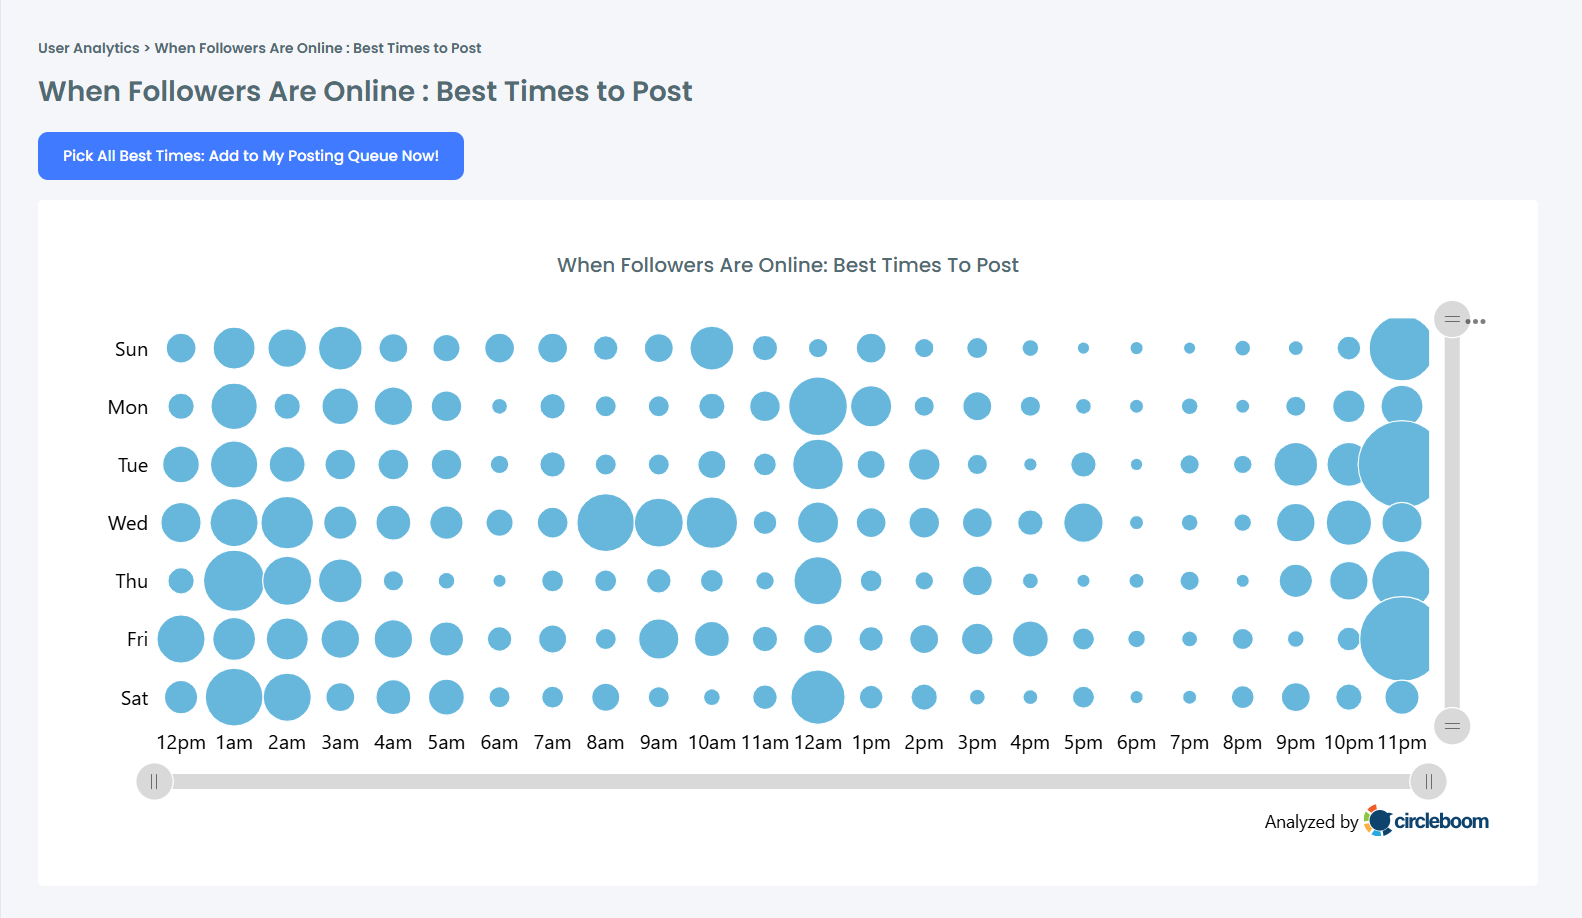
🟠 Optimize Posting Strategy: Identify the best times to post on Twitter/X and which types of content work best.
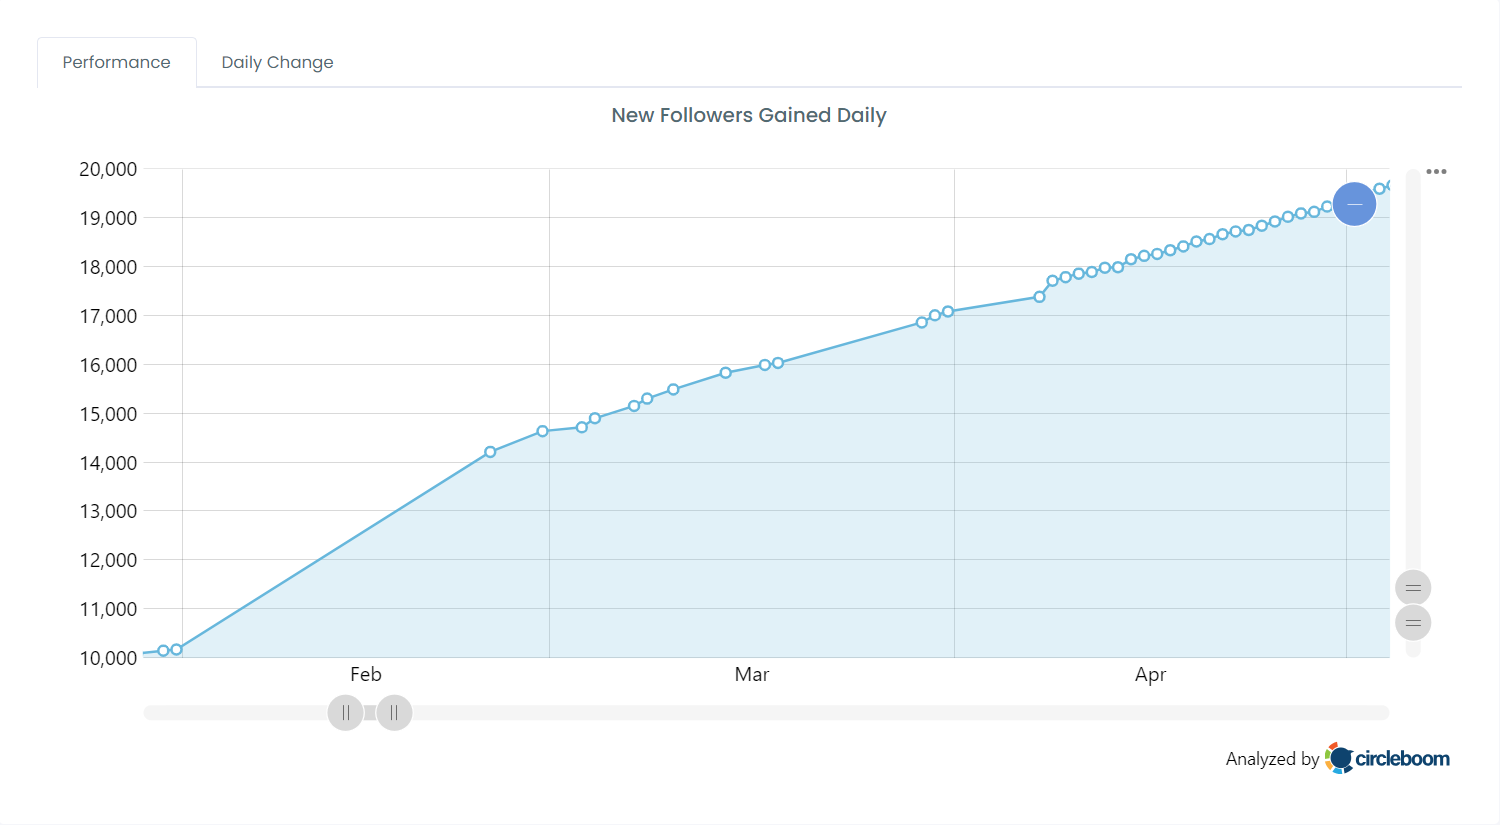
🔵 Measure Growth: Monitor your follower count, profile visits, and overall account activity to assess your progress.
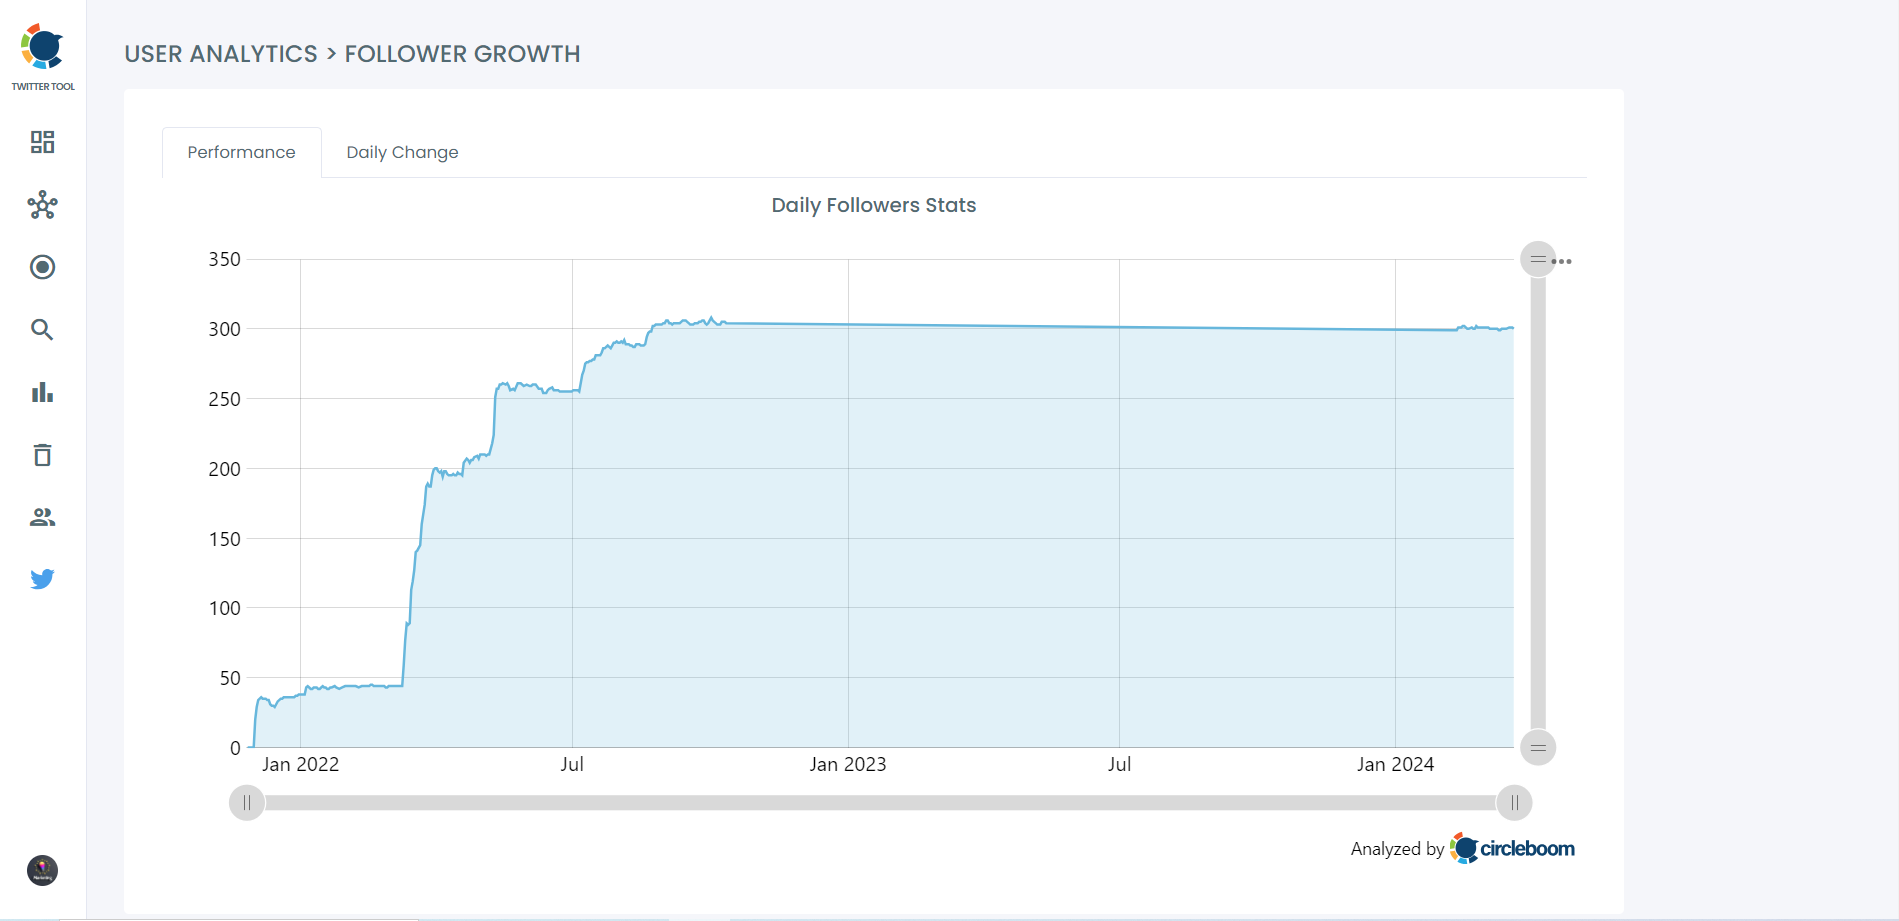
🟡 Profile Visits: Do people wonder who is the creator behind these amazing posts? If they do, they will visit your profile!
Circleboom lets you check profile visit analytics with advanced graphs!
With this information, you can make informed decisions to improve your Twitter strategy and boost your presence on the platform.
Accessing Twitter Analytics (Premium Required)
Twitter provides an in-platform analytics feature, but it’s only accessible to premium account holders. Here’s how you can access it:
Step-by-Step Guide to Access Twitter Analytics
- Click on “X Premium” from the left-hand panel.
- Under “Quick Access,” select “Analytics.”
- Find your basic insights and statistics.
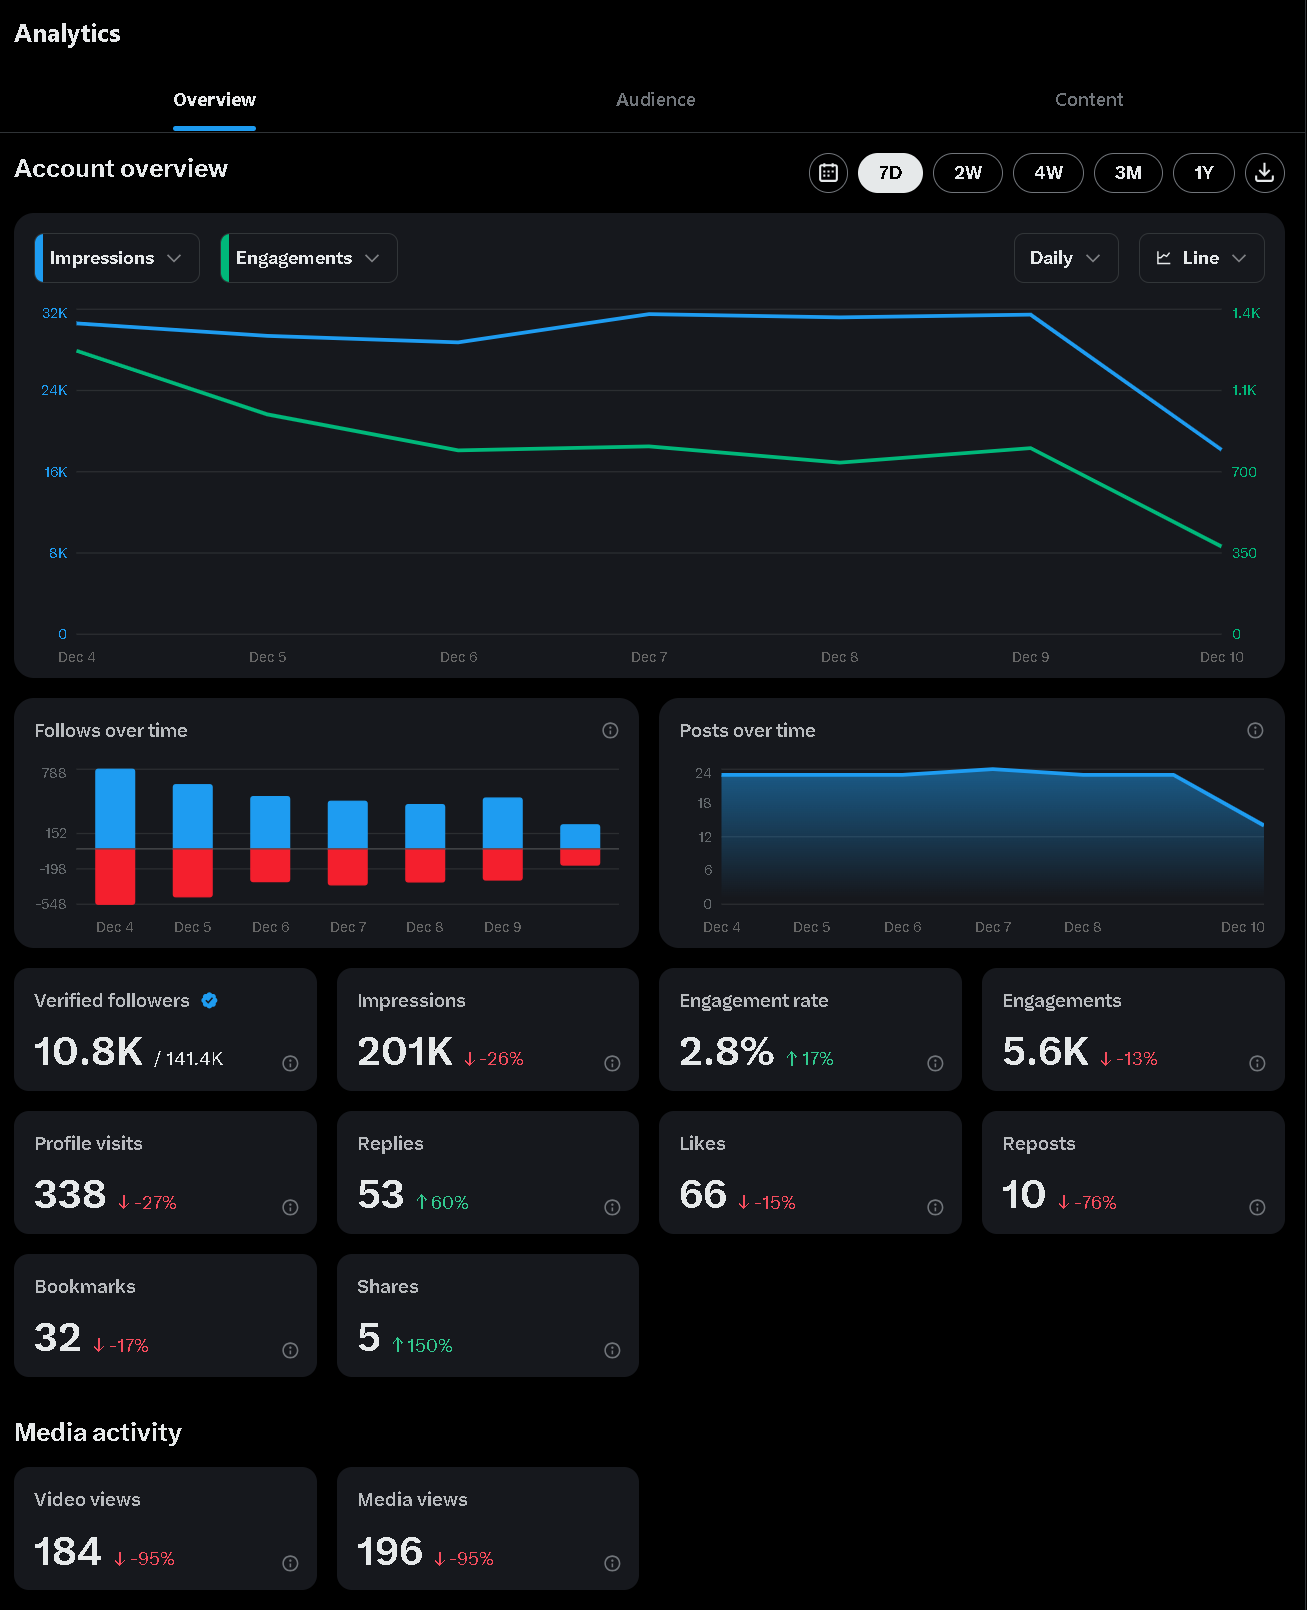
You will find your X Analytics:
While Twitter’s analytics provide helpful data, they’re limited in scope and lack granular details about individual posts and followers.
Weaknesses of Twitter Analytics
While Twitter Analytics offers some valuable insights, it has notable drawbacks. Accessing full features requires a premium subscription, which isn’t feasible for everyone.
These limitations can hinder a comprehensive understanding of your audience and strategy optimization.
What can I do if Twitter Analytics is not working?
Twitter Analytics has traditionally been the preferred tool for this, but many users have recently faced issues with its functionality.
From loading failures and inaccurate data to complete inaccessibility, these disruptions can be quite frustrating.
If you're facing issues with Twitter Analytics or don't have a premium subscription, there are still effective ways to track your Twitter performance.
Altug Altug
Why I Prefer Circleboom Twitter for Analytics
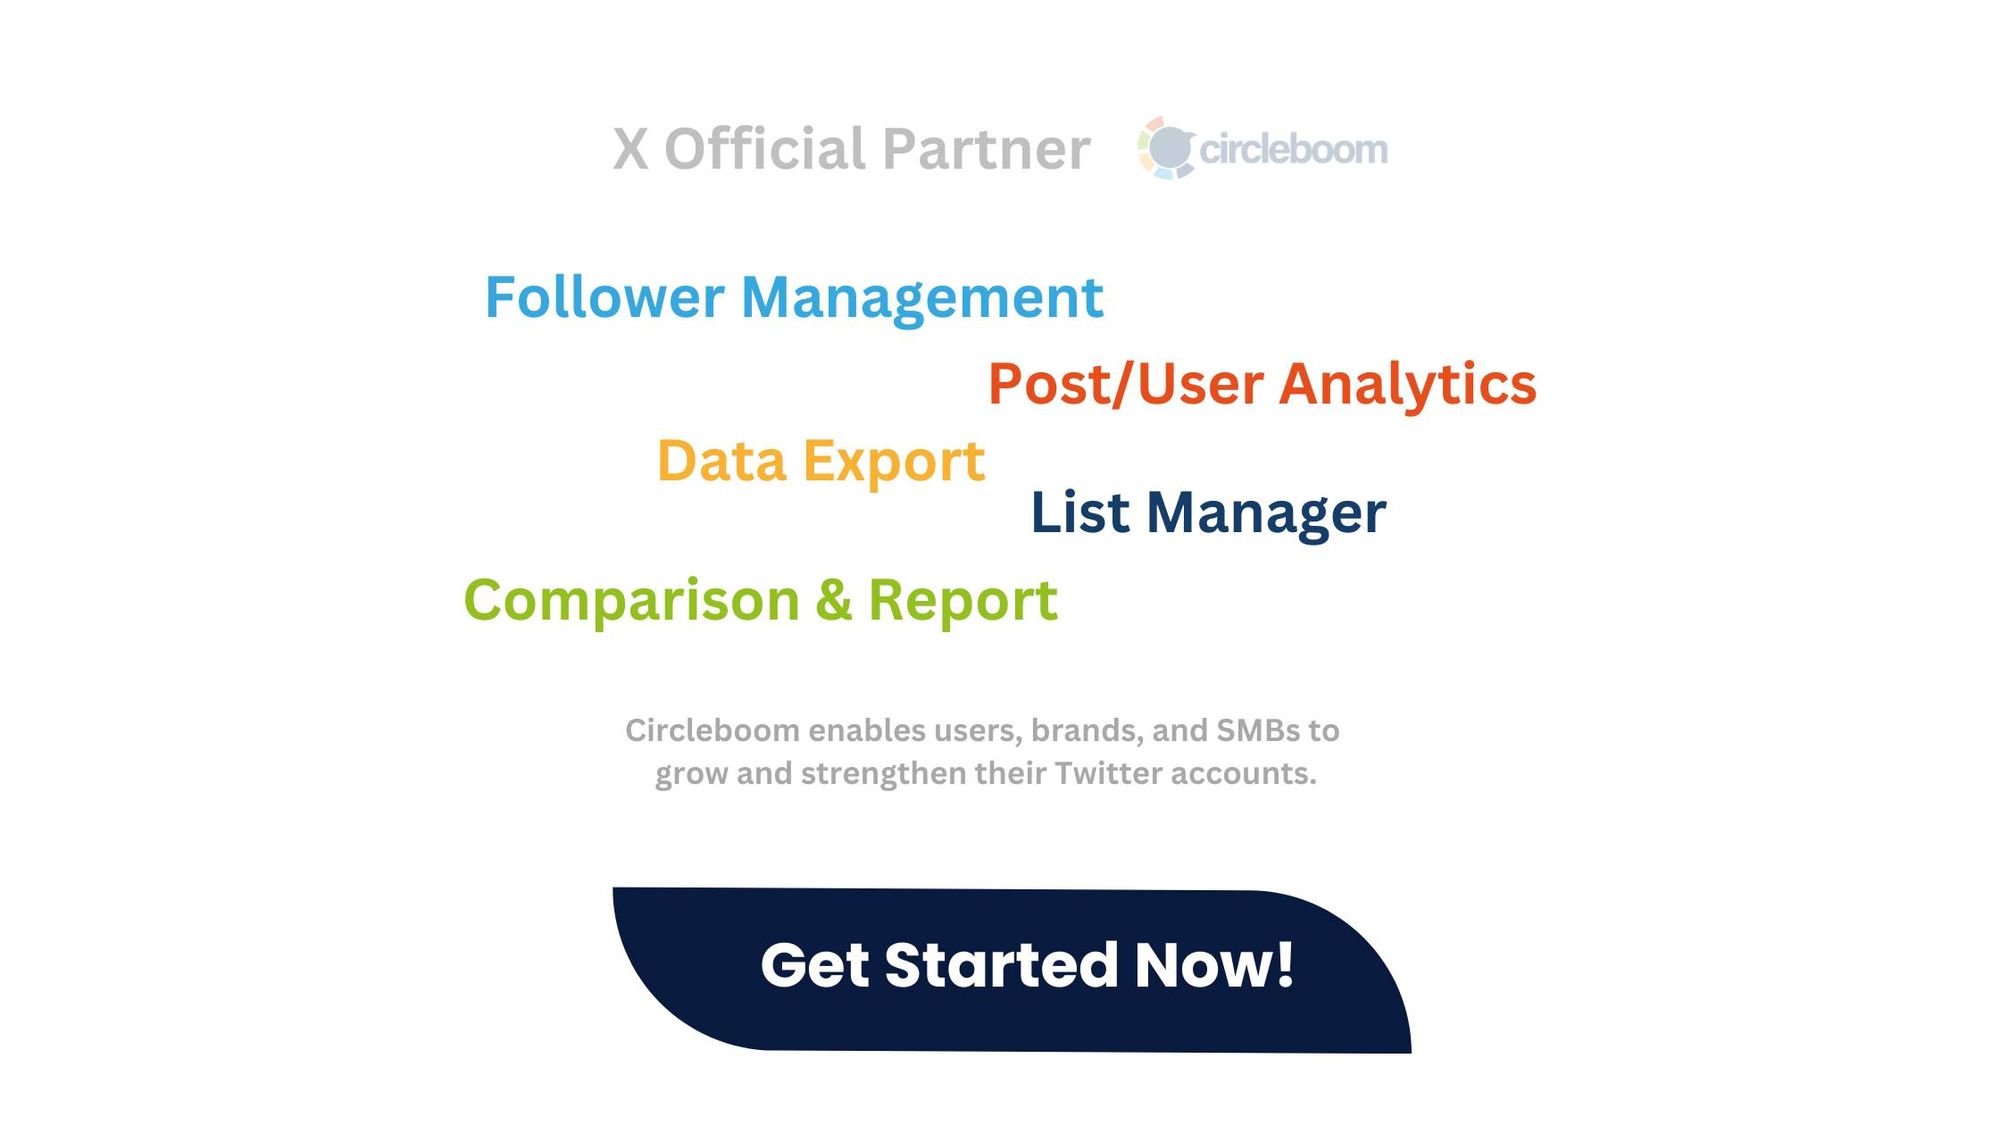
Analytics play a vital role in crafting an impactful Twitter strategy, and Circleboom Twitter offers a unique advantage by going beyond basic metrics by providing both Account Analytics and Post Analytics, without Premium.
Unlike Twitter’s built-in tools, Circleboom delivers:
➡️ Comprehensive Insights: Dive into detailed data about your posts, followers, and overall account performance.
➡️ Customizable Reports: Tailor your analysis with filters to focus on specific metrics or trends.
➡️ Convenience: Analyze your performance without needing a premium Twitter account, saving both time and resources.
Circleboom Twitter empowers users with tools to not only monitor performance but also take action.
For instance, it’s easy to identify inactive accounts, track audience demographics, or even plan content with AI-powered tweet generators. This combination of analytics and actionable tools ensures a streamlined approach to social media management.
Arif Akdogan
How to Use Circleboom Twitter’s Post Analytics
Here’s how you can leverage Circleboom to check detailed Twitter analytics:
Step-by-Step Guide to Circleboom Twitter’s Post Analytics
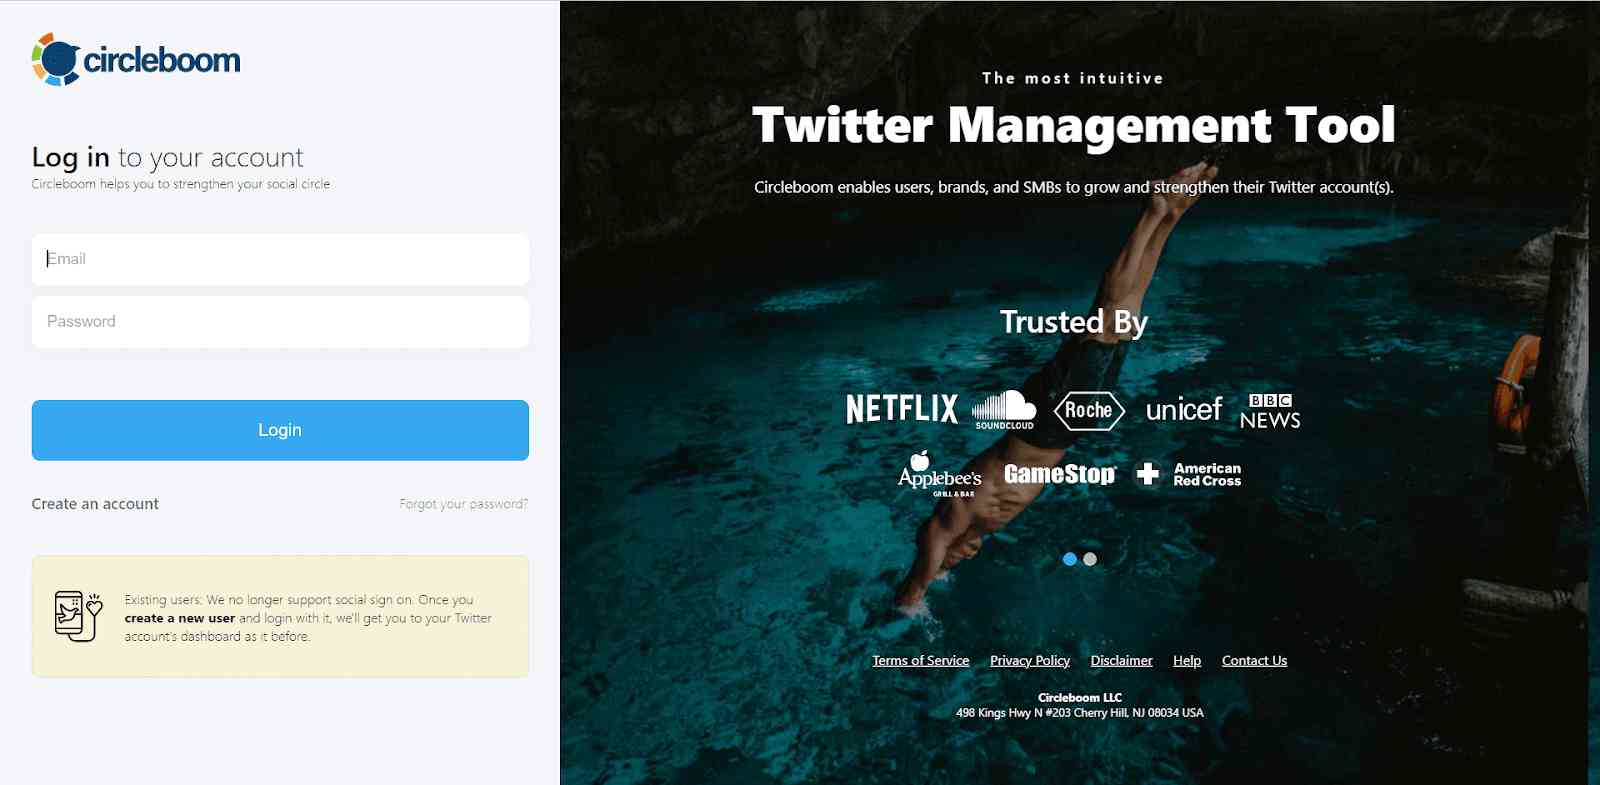
Step #1: Log In to Circleboom Twitter
Go to the Circleboom Twitter website and log in with your credentials. If you’re a new user, sign up—it’s quick and easy!
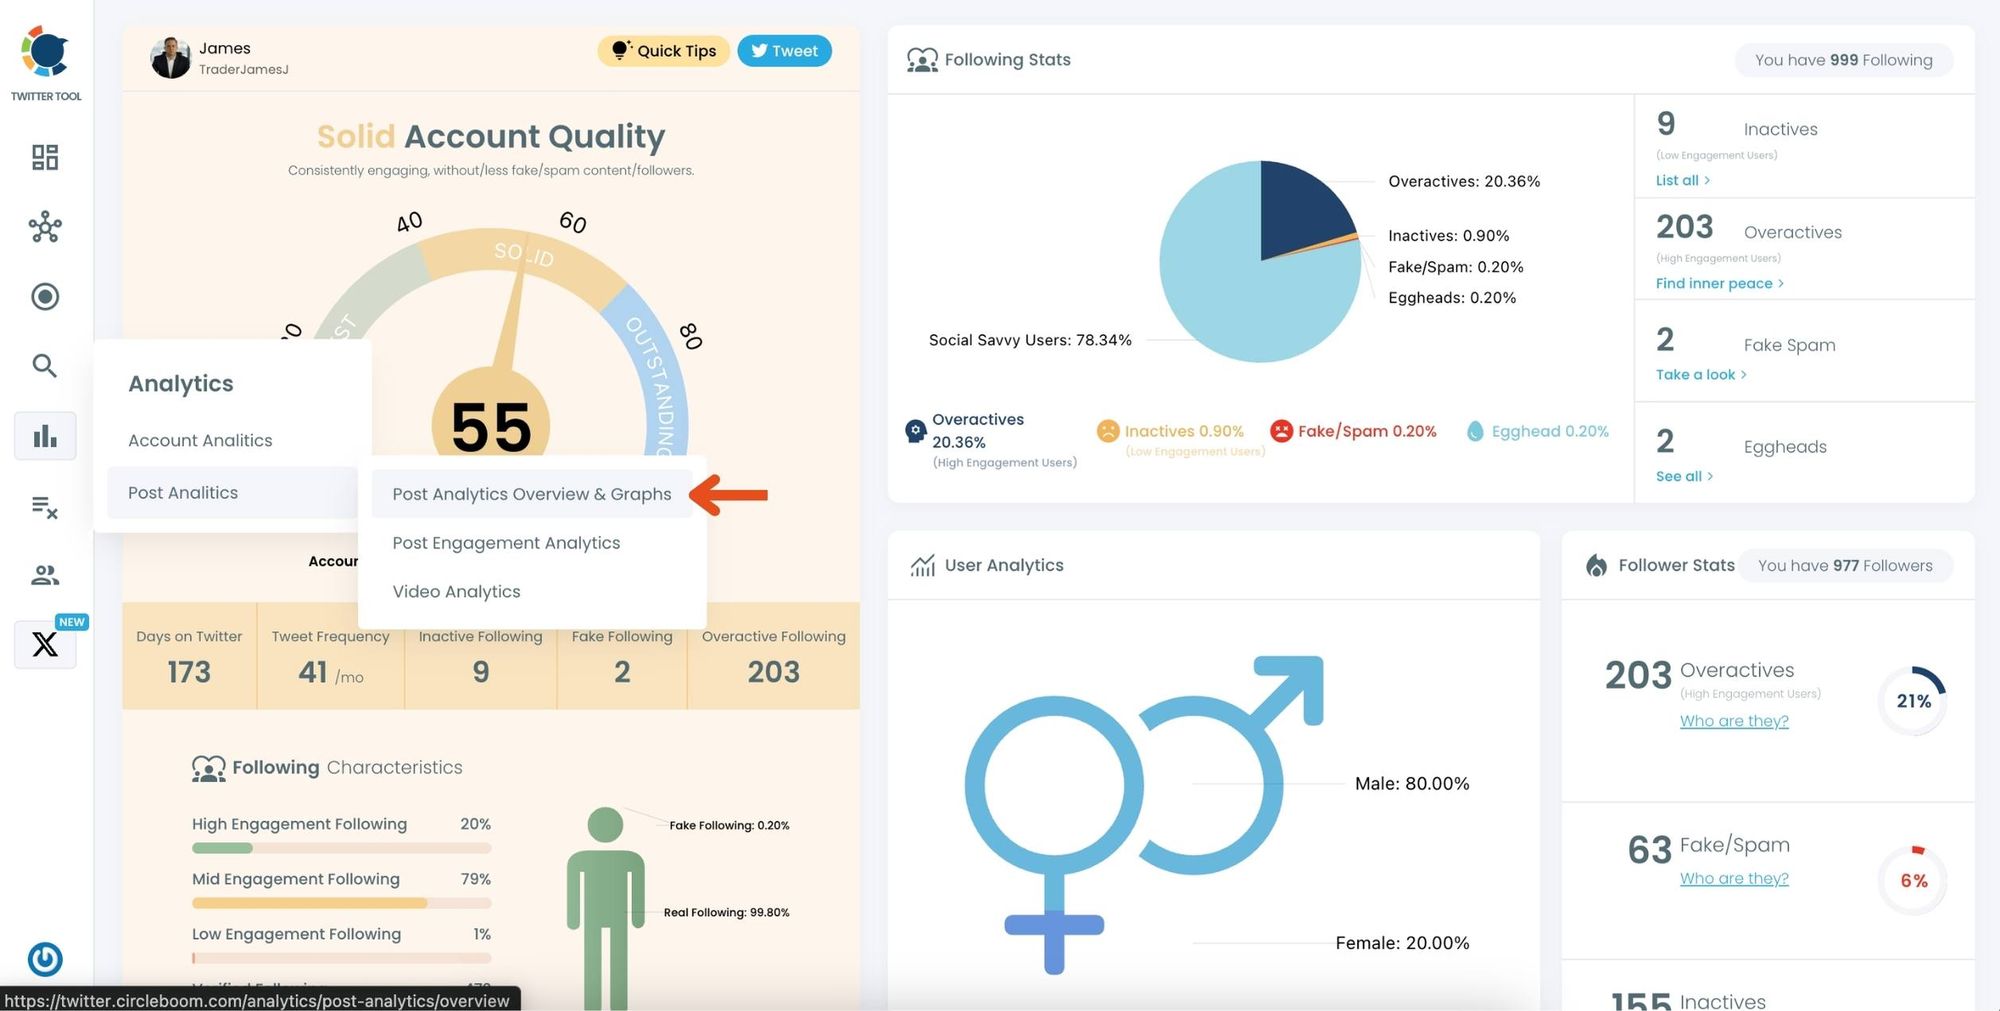
Step #2: Navigate to the Analytics Menu
From the left-hand menu, click on the "Analytics" tab, then select "Post Analytics" from the dropdown.
Within Post Analytics, select the "Post Analytics Overview & Graphs" option.
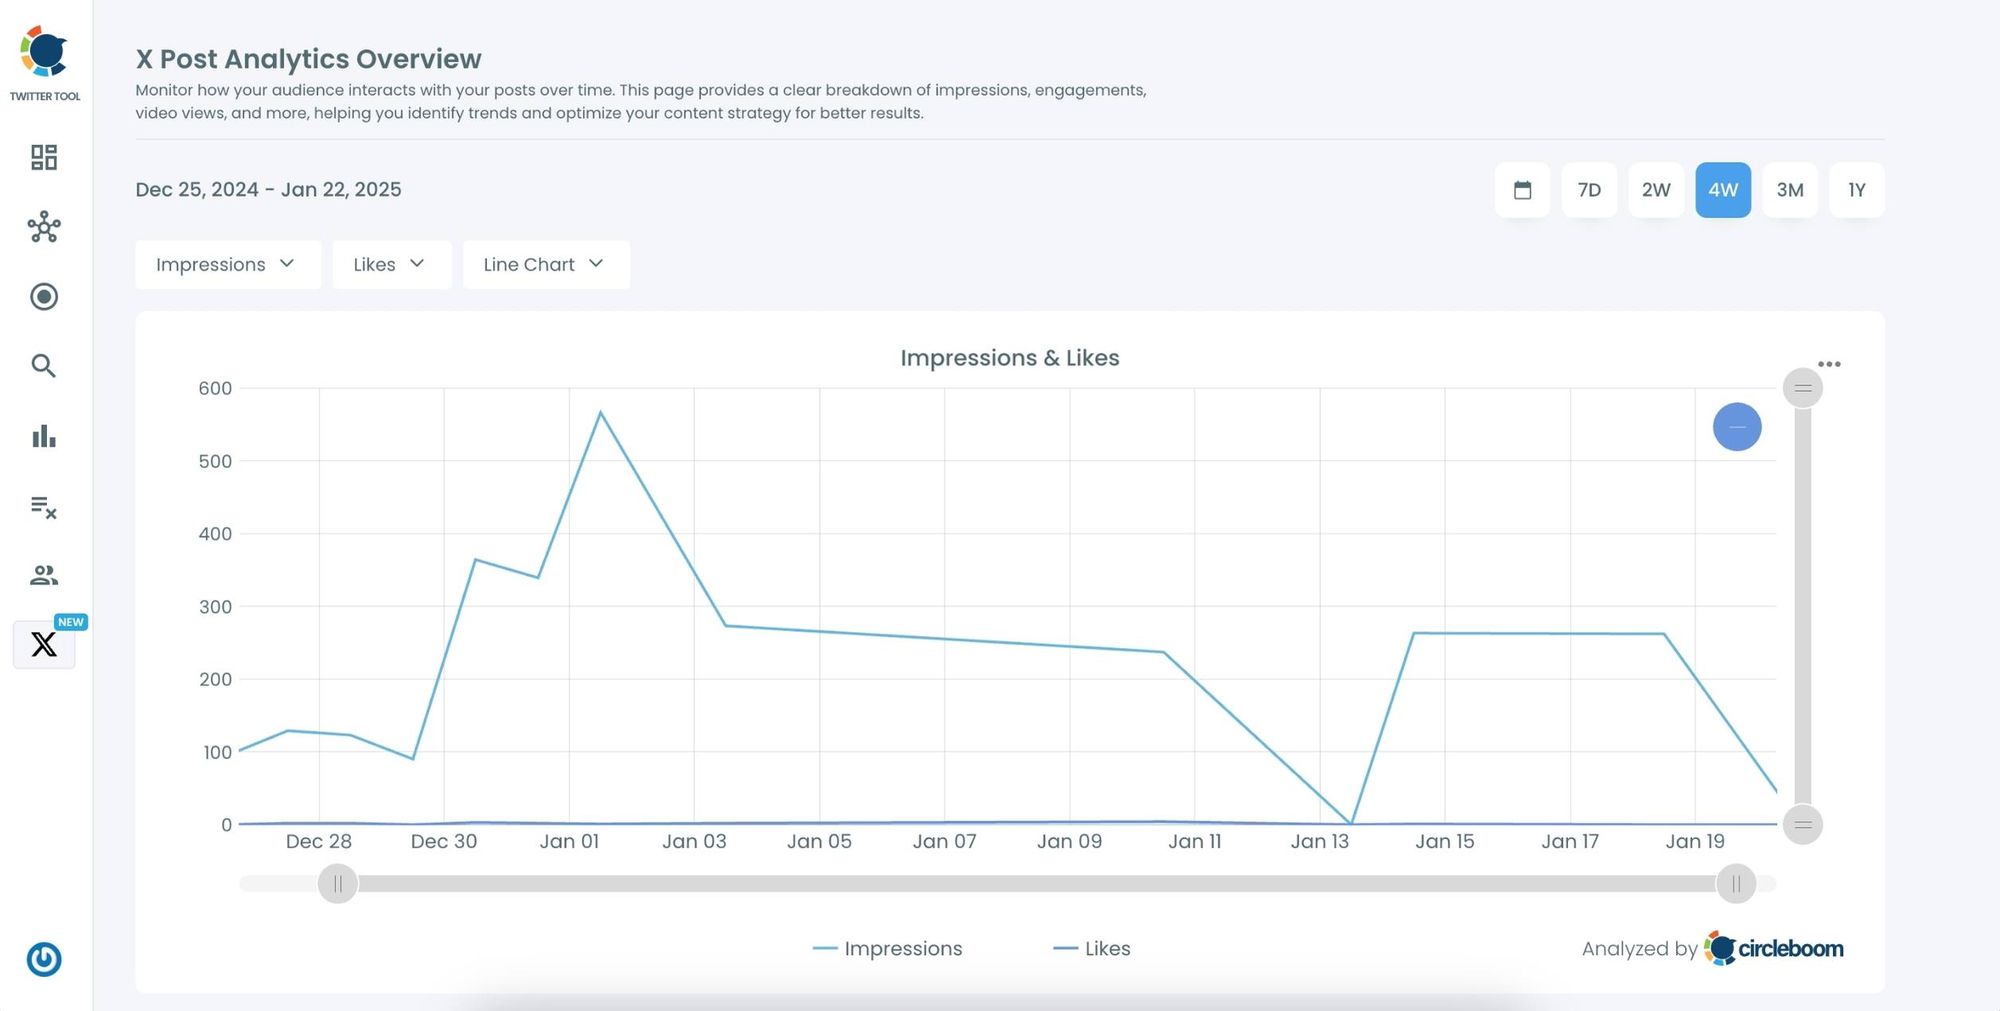
Step #3: Analyze the Graphs
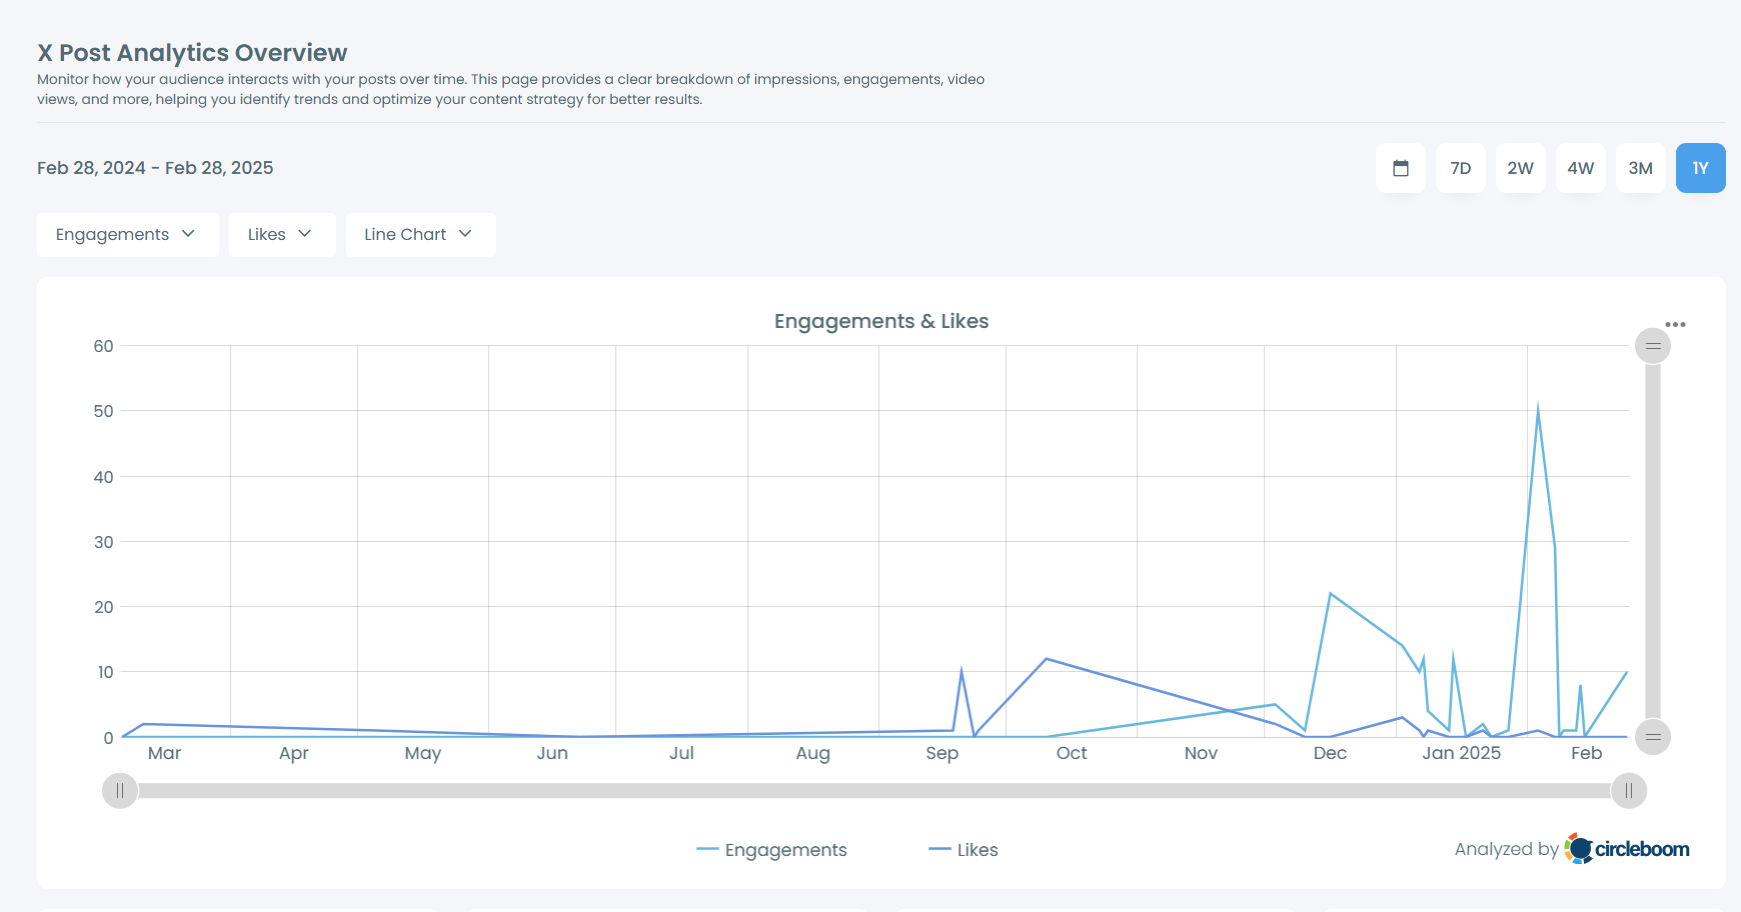
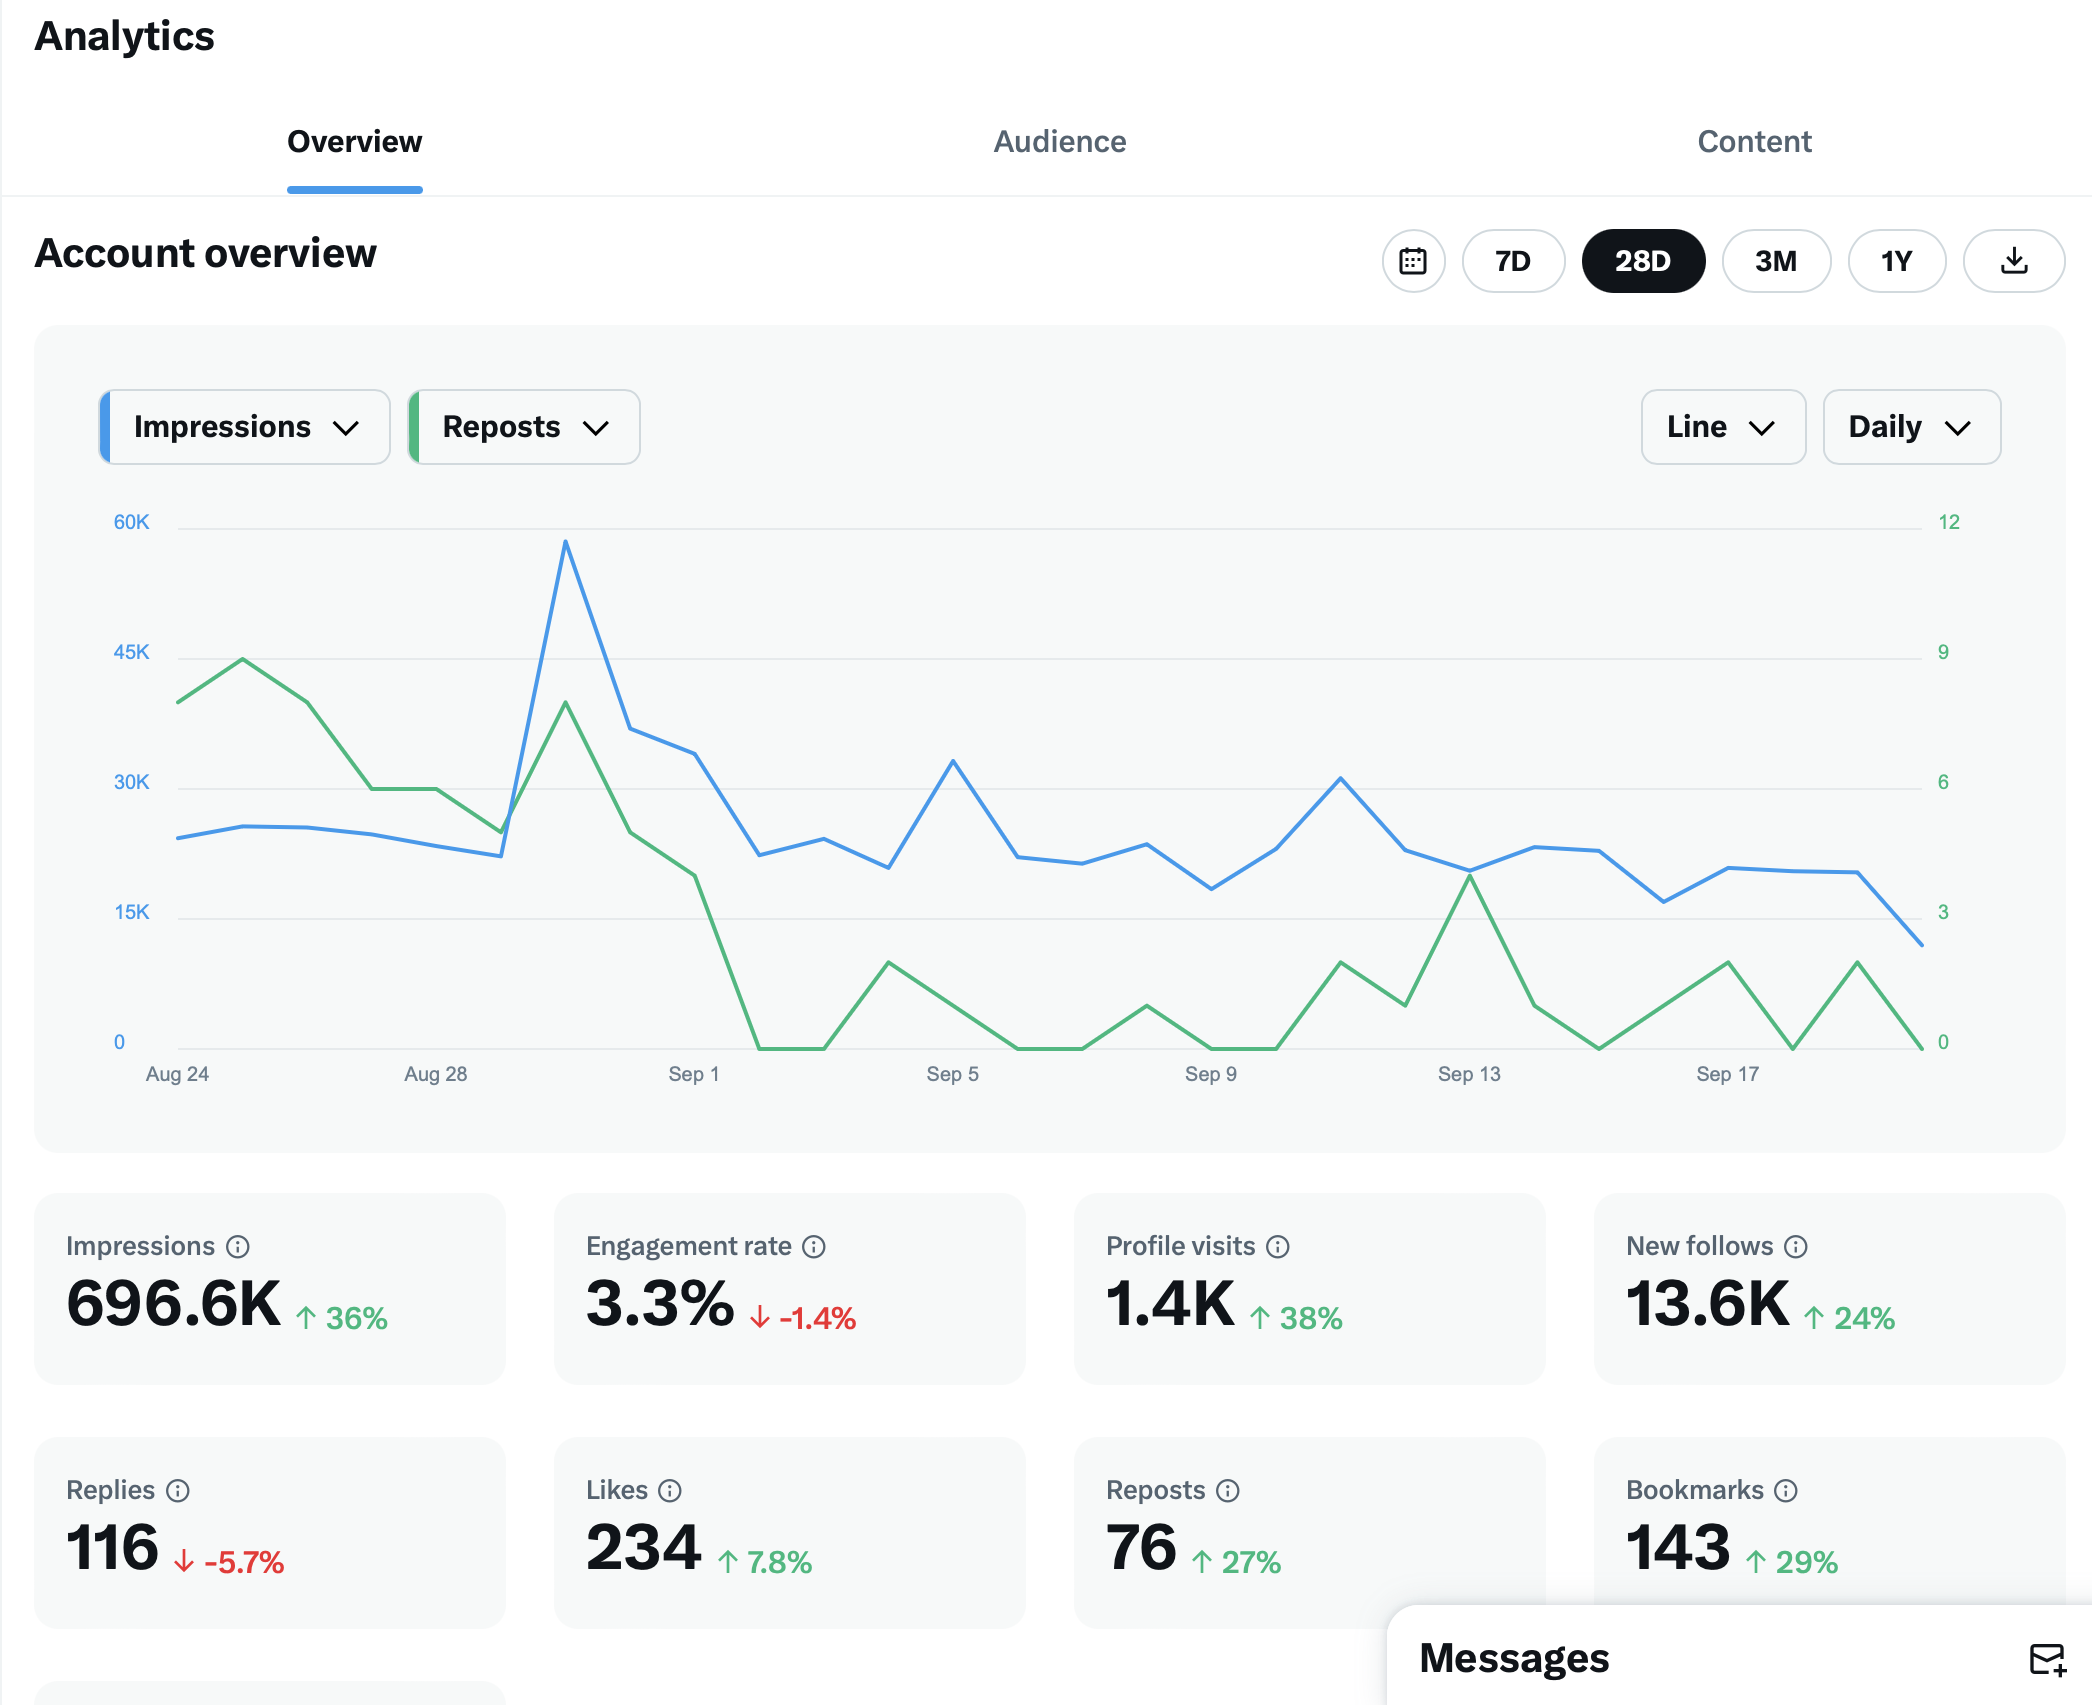
You'll see a line graph labeled "Impressions & Likes." This graph shows trends over time.
Adjust the time frame above the graph (e.g., 7D, 2W, 4W, 3M, 1Y) to view data from different periods.
Below or next to the graph, look for detailed metrics such as total impressions, likes, reposts, replies, and engagement figures.
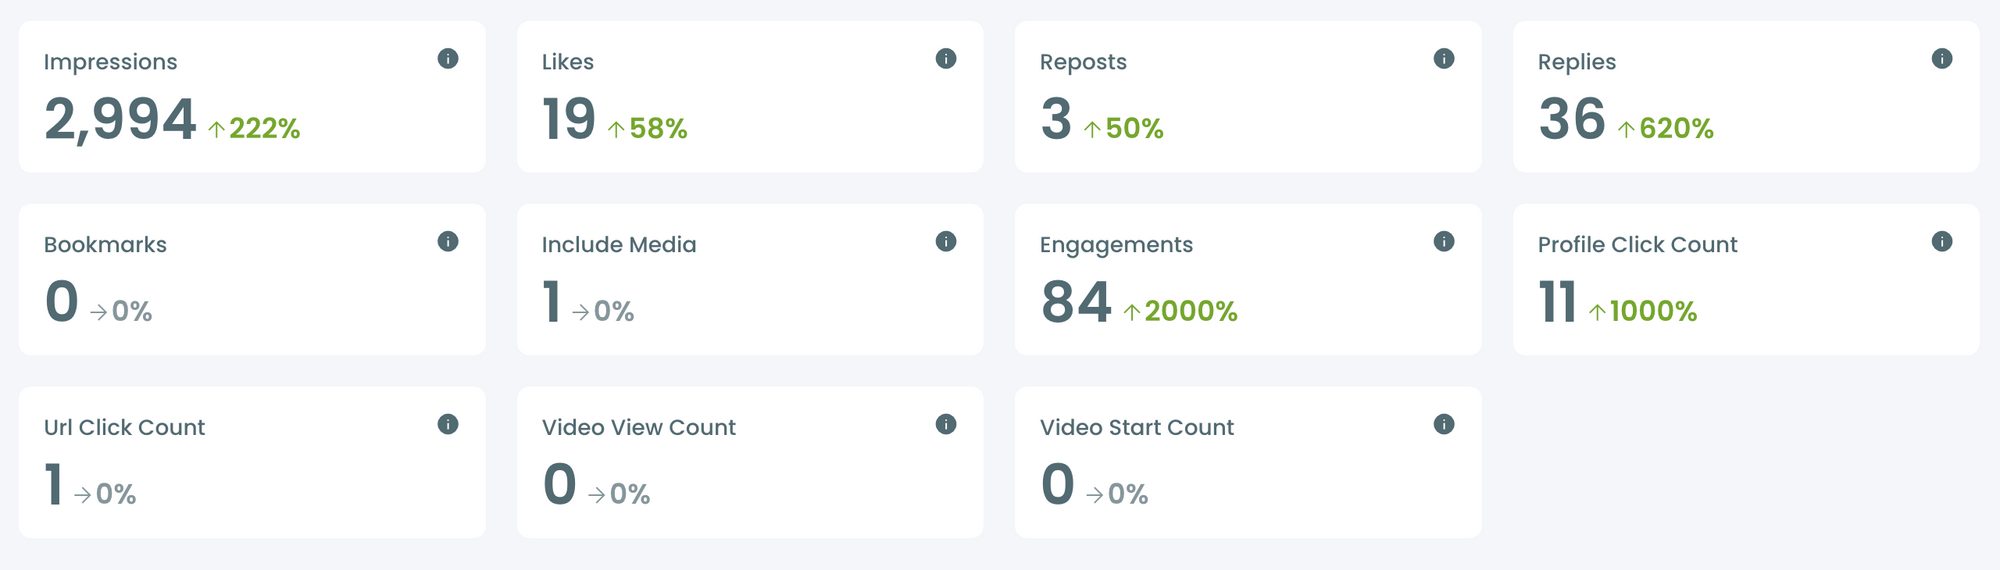
These metrics often come with percentage changes indicating an increase or decrease compared to a previous period.
How to use Post Engagement Analytics:
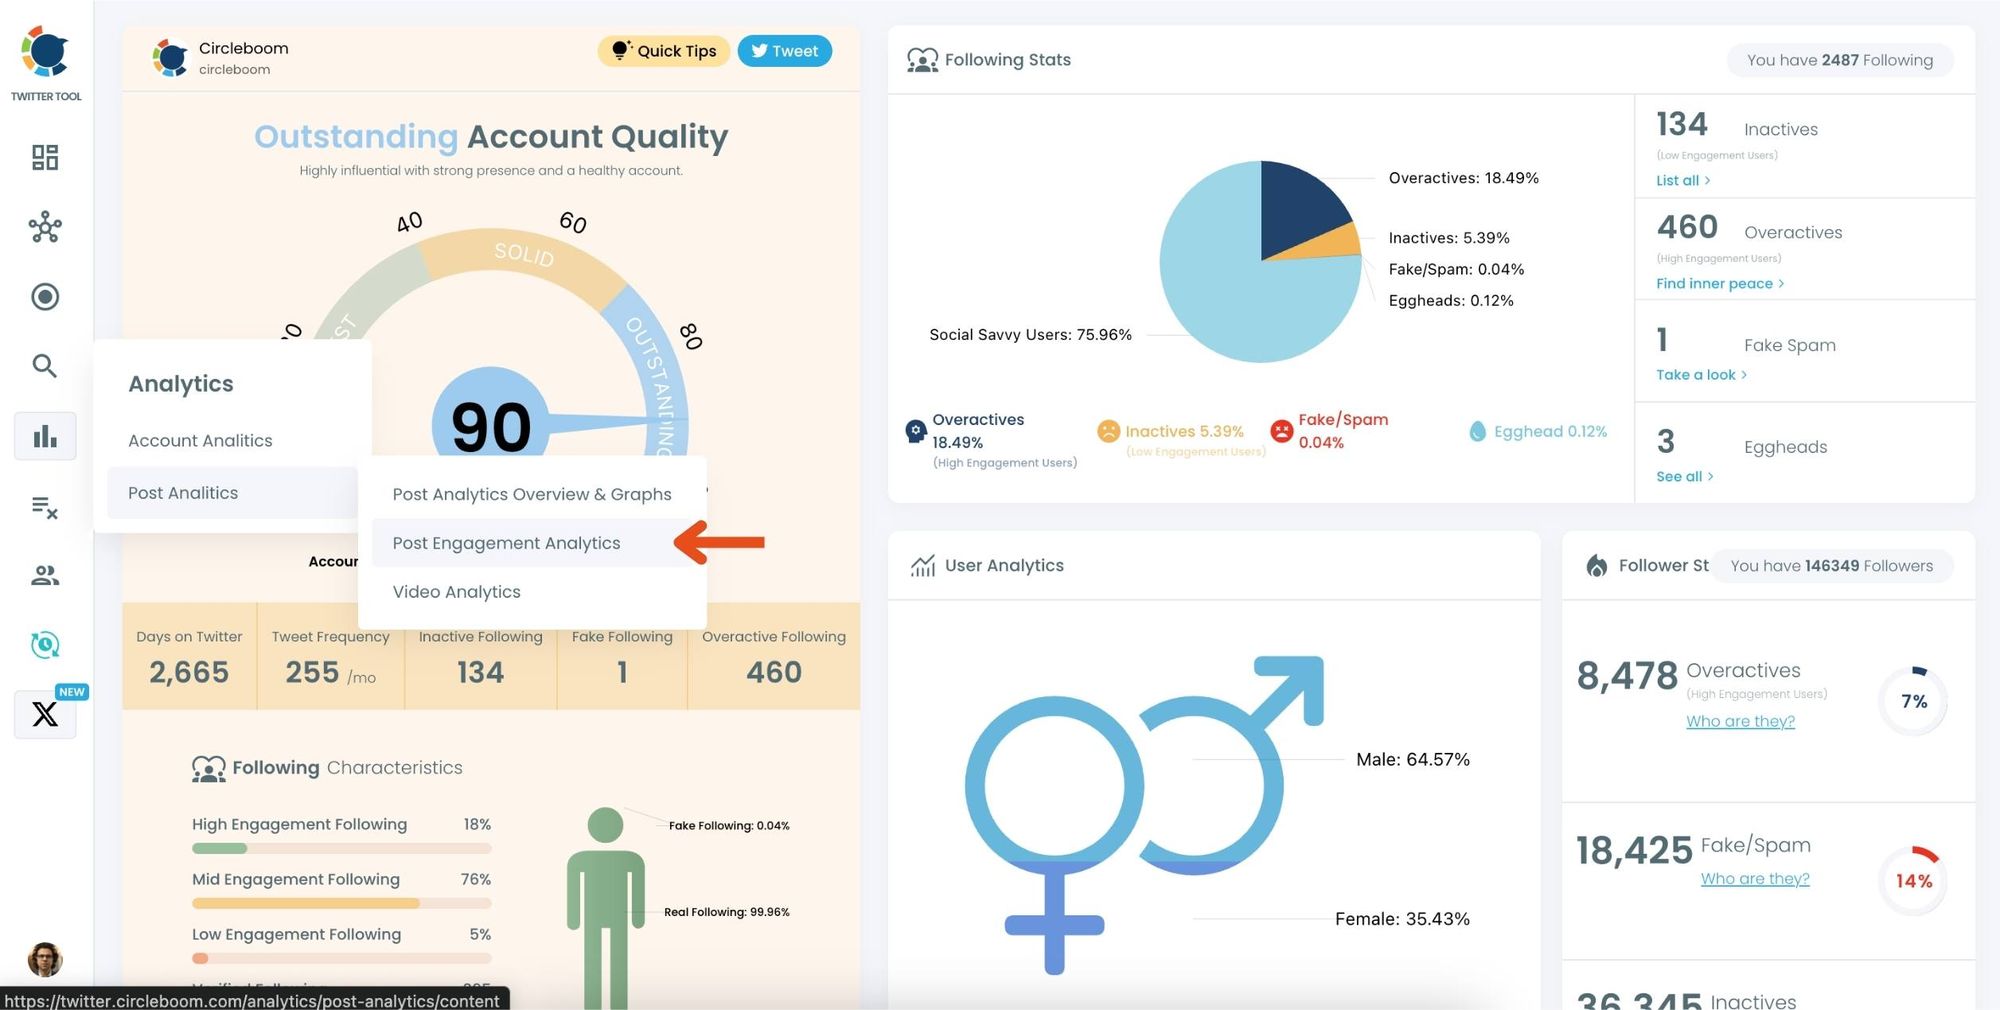
Step #1: Navigate to the Analytics Menu
From the left-hand menu, click on the "Analytics" tab, then select "Post Analytics" from the dropdown.
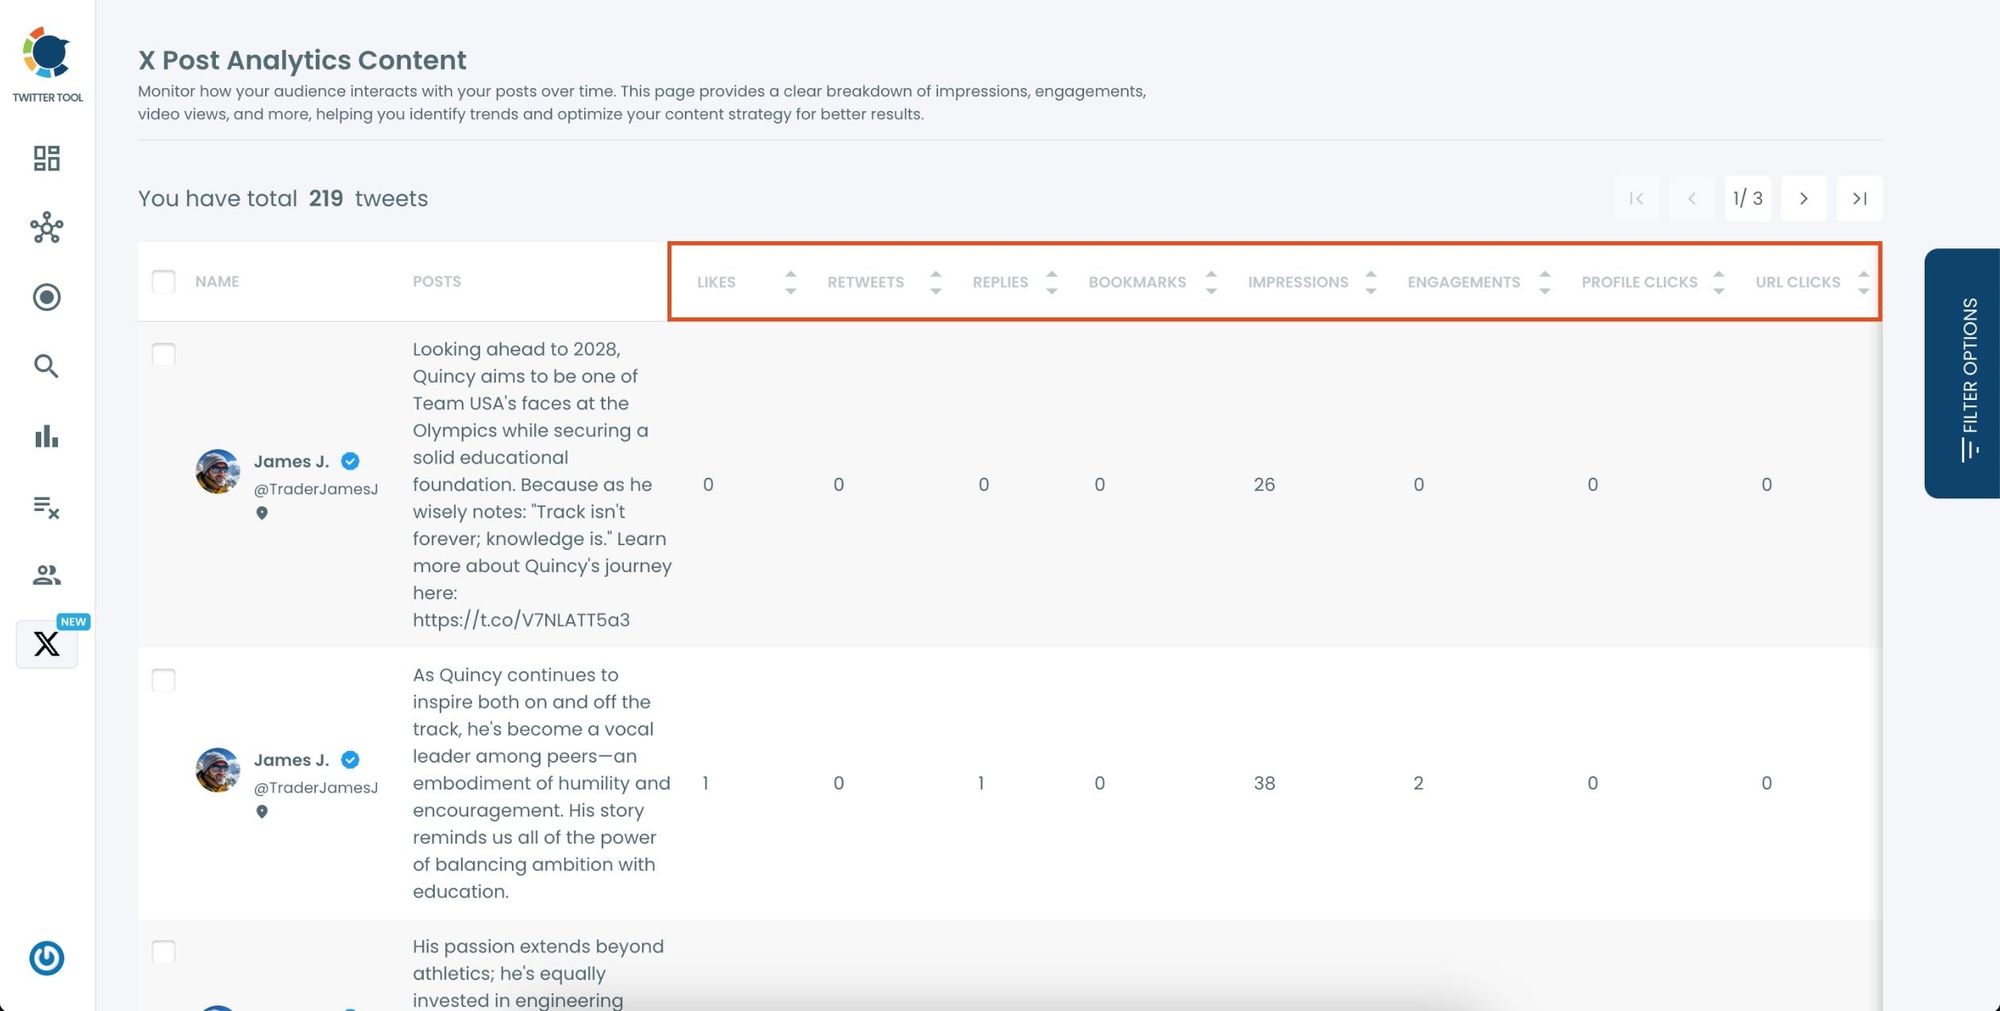
Within Post Analytics, select the "Post Engagement Analytics" option.
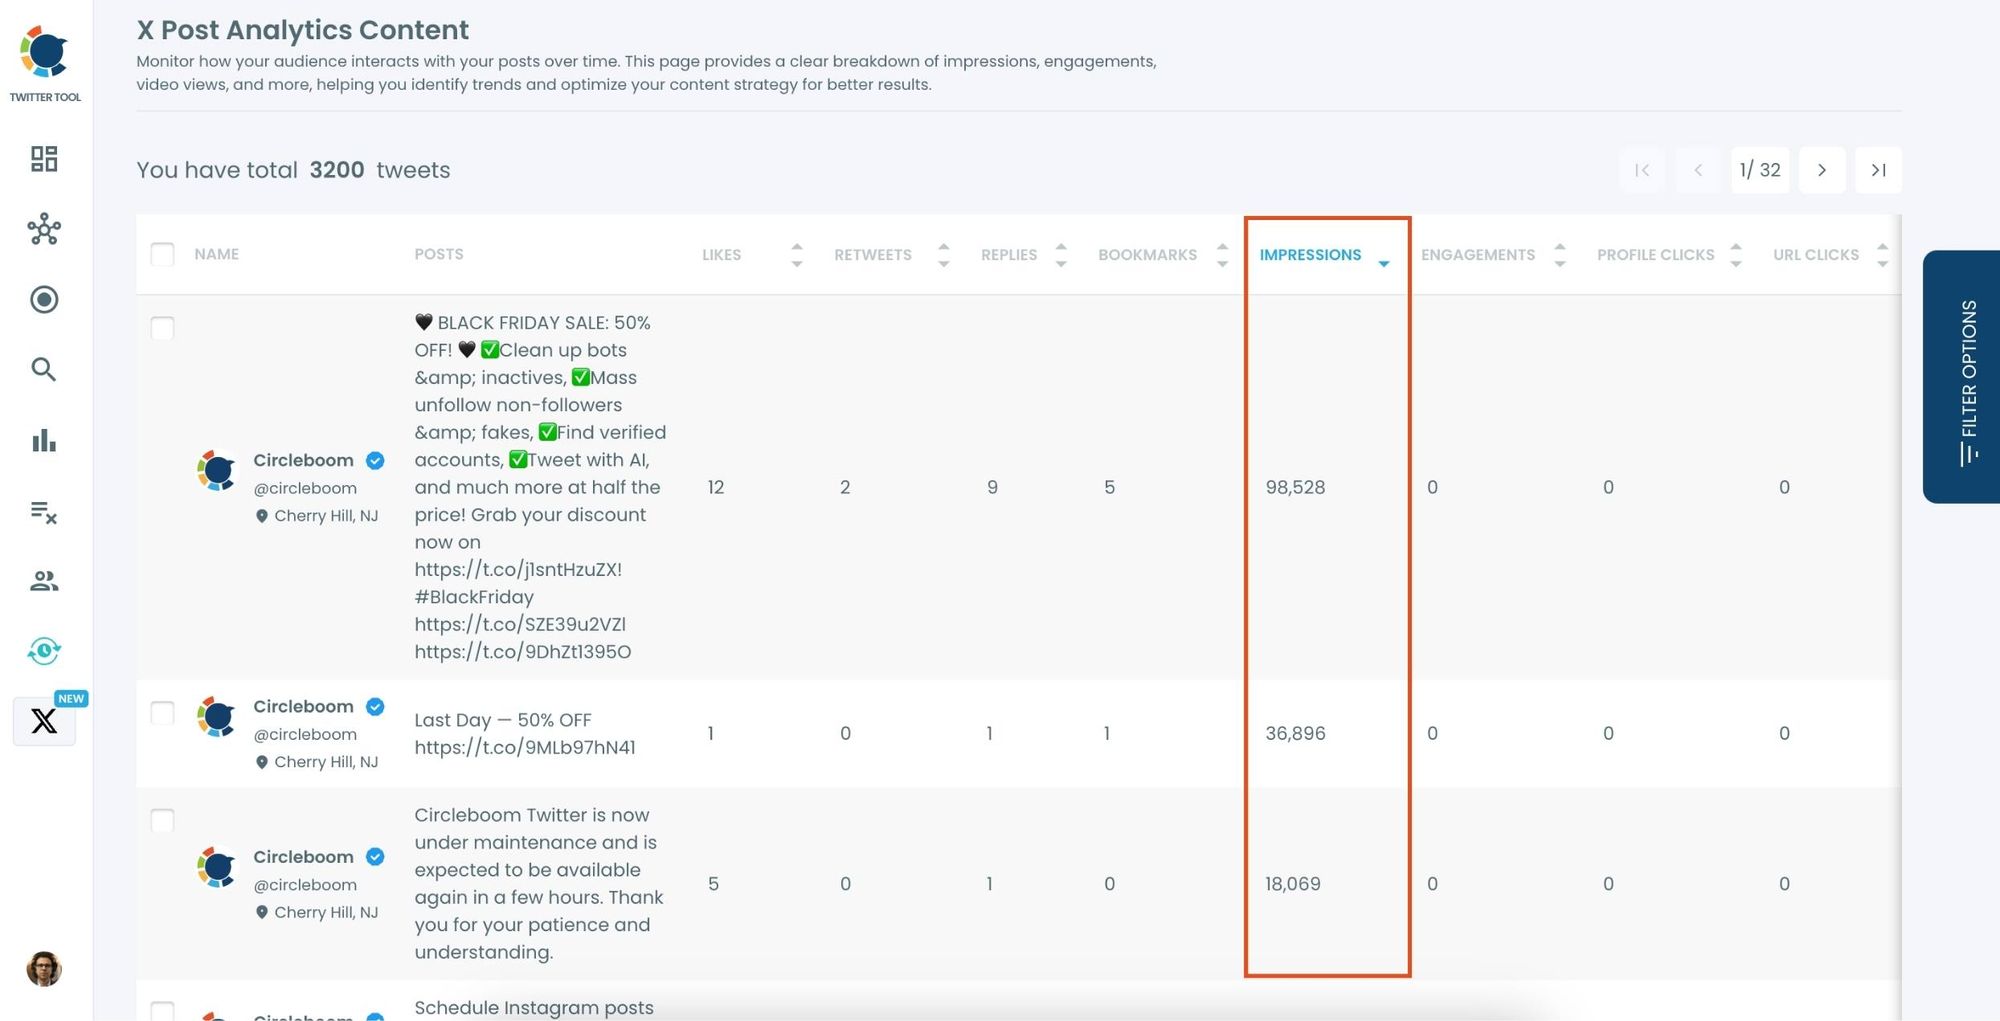
Circleboom will display a detailed breakdown of your posts, including metrics like impressions, likes, retweets, replies, and more.
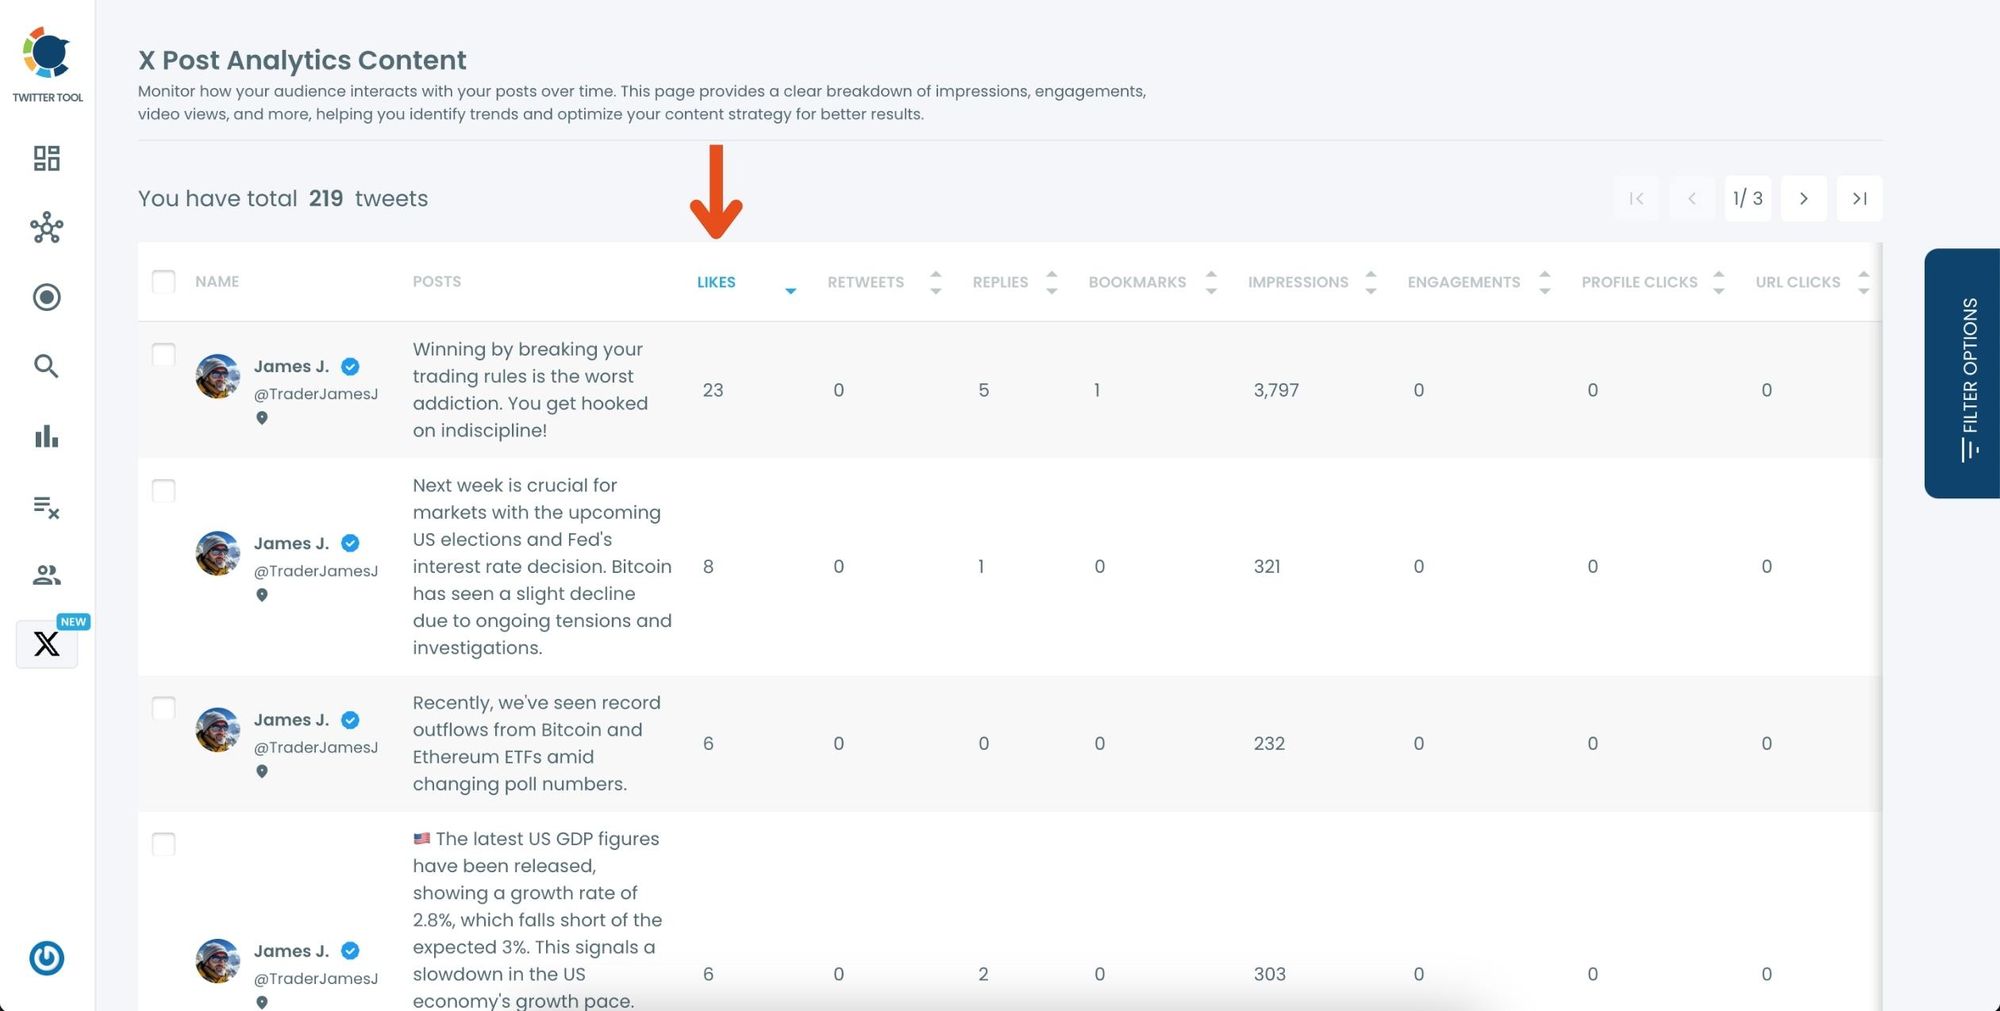
Step #2: Sort by Likes
Locate the "Likes" column in the content list. Click on the column heading, and Circleboom will automatically arrange your tweets from the highest to the lowest number of likes.
Altug Altug
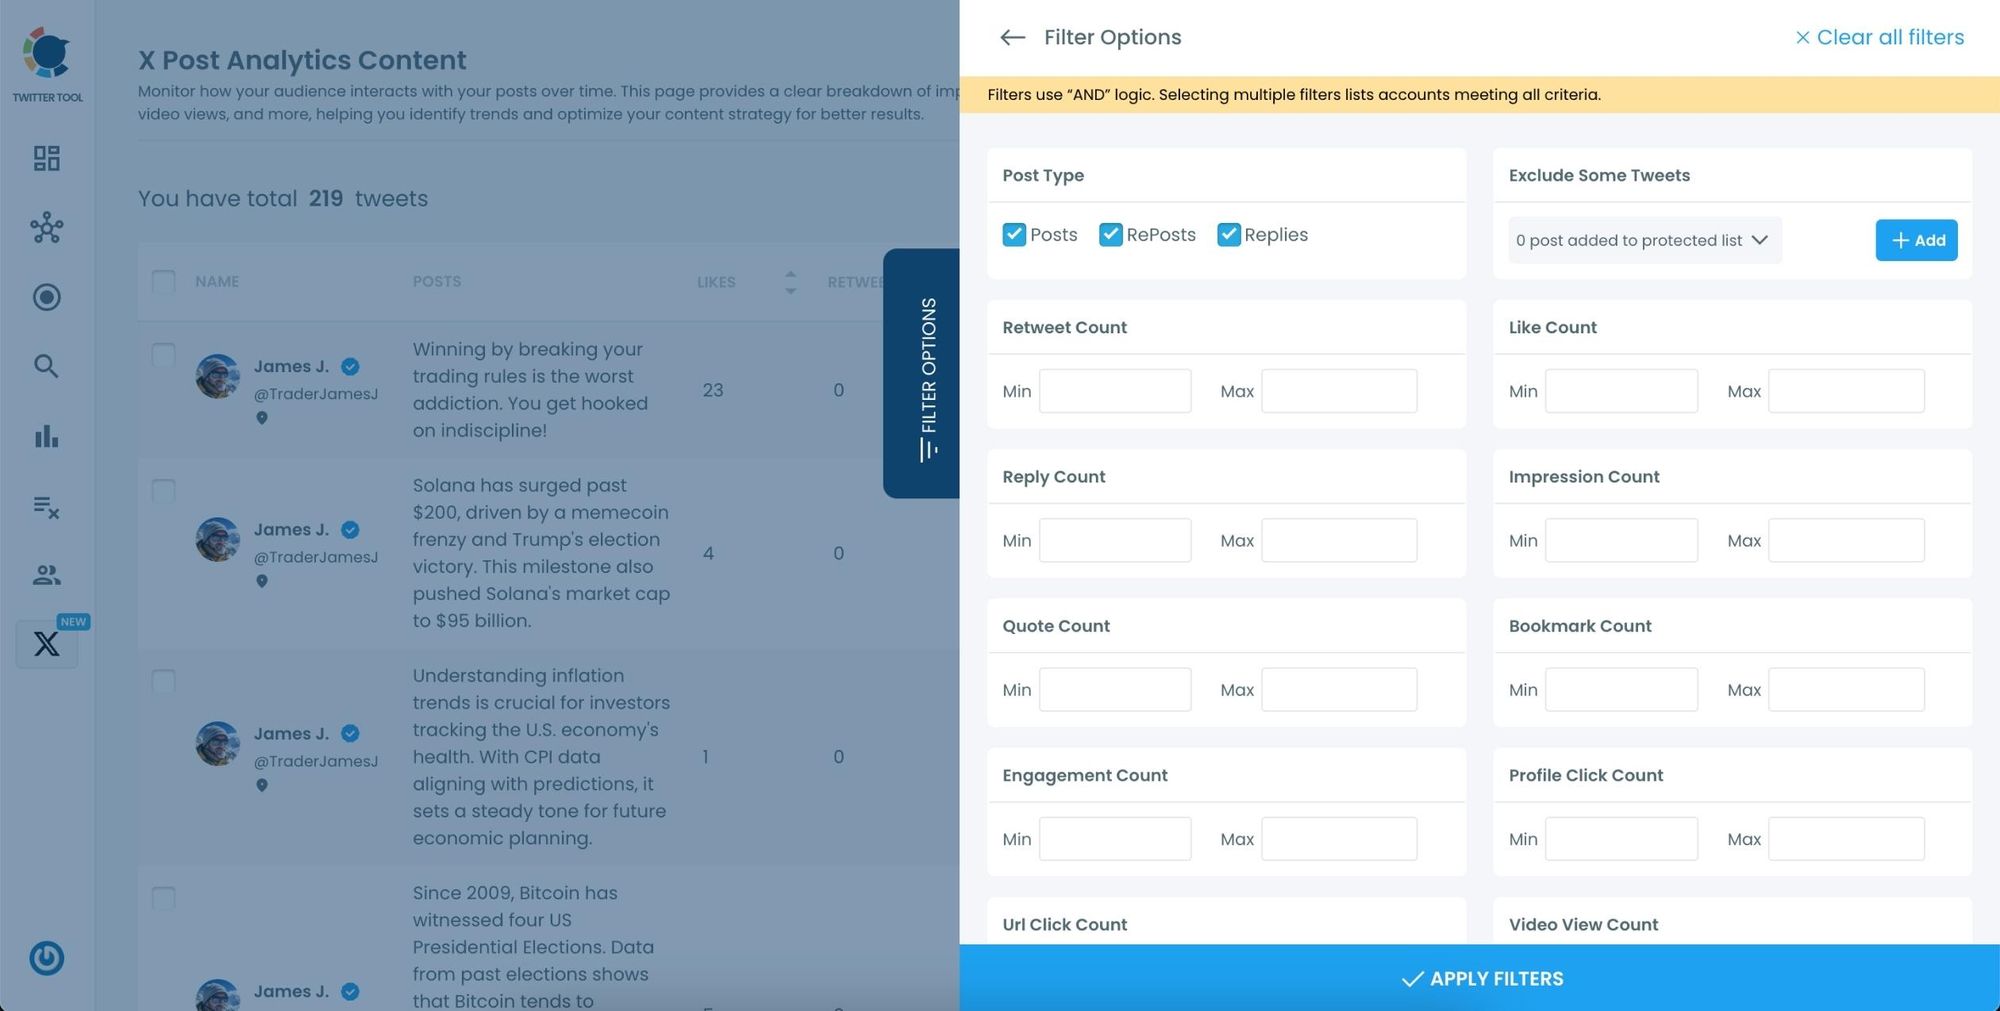
Step #3: Use Advanced Filters (Optional)
For a more focused analysis, click on the "Filter Options" button.
You can refine your search by metrics like date, engagement type, or other performance indicators to identify specific trends.
With these steps, you can uncover insights that help refine your Twitter strategy and boost engagement. Circleboom made it super easy to check analytics on Twitter!
Bonus Feature: Use Video Analysis for Media Tweets
Circleboom also provides a unique analysis tool for media tweets. If you have video tweets, you should use them to better understand your video engagement.
Let me show how it works in the example of seeing video impressions:
Step #1: Navigate to the Analytics Menu
From the left-hand menu, click on the "Analytics" tab, then select "Post Analytics" from the dropdown.
Within Post Analytics, select the "Post Engagement Analytics" option.

Circleboom will display a detailed breakdown of your posts, including metrics like impressions, likes, retweets, replies, and more.
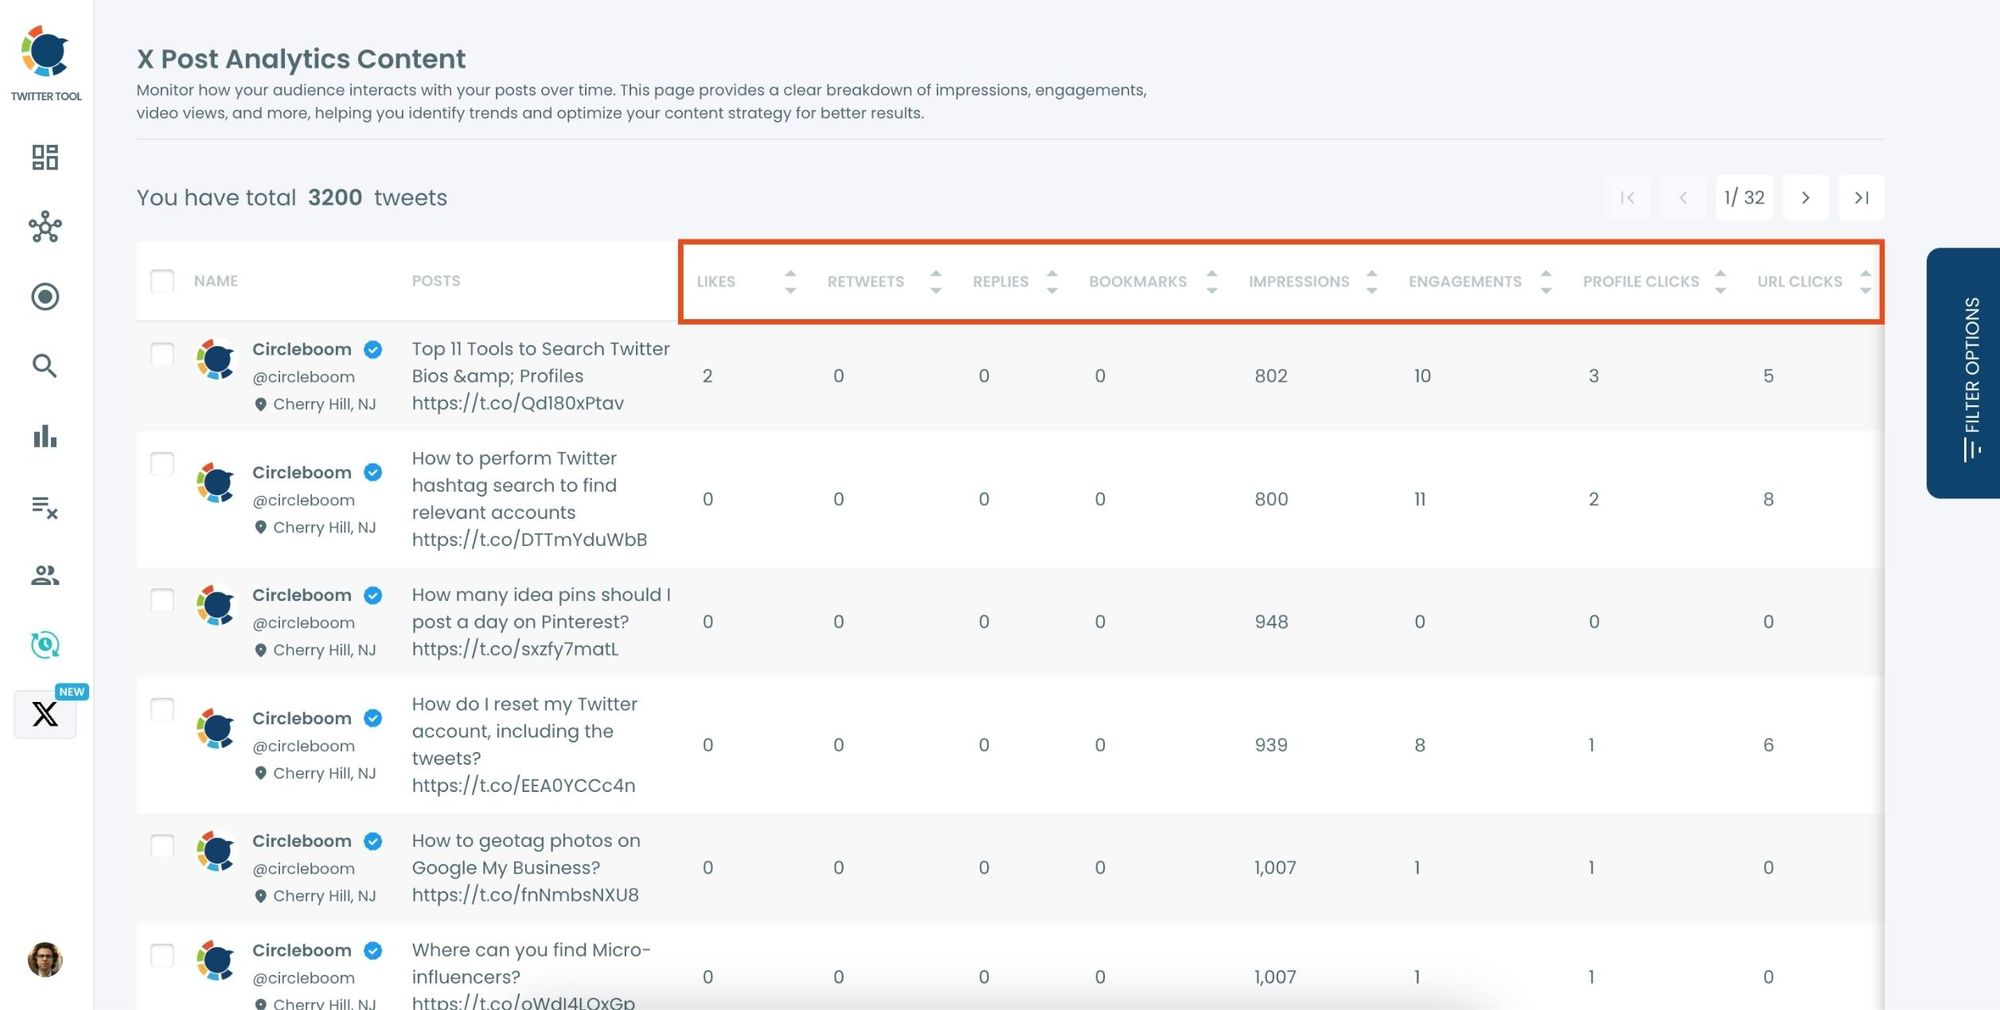
Step #2: Sort by Impressions
Locate the "Impressions" column in the content list.
Click on the column heading, and Circleboom will automatically arrange your tweets from the highest to the lowest number of likes.
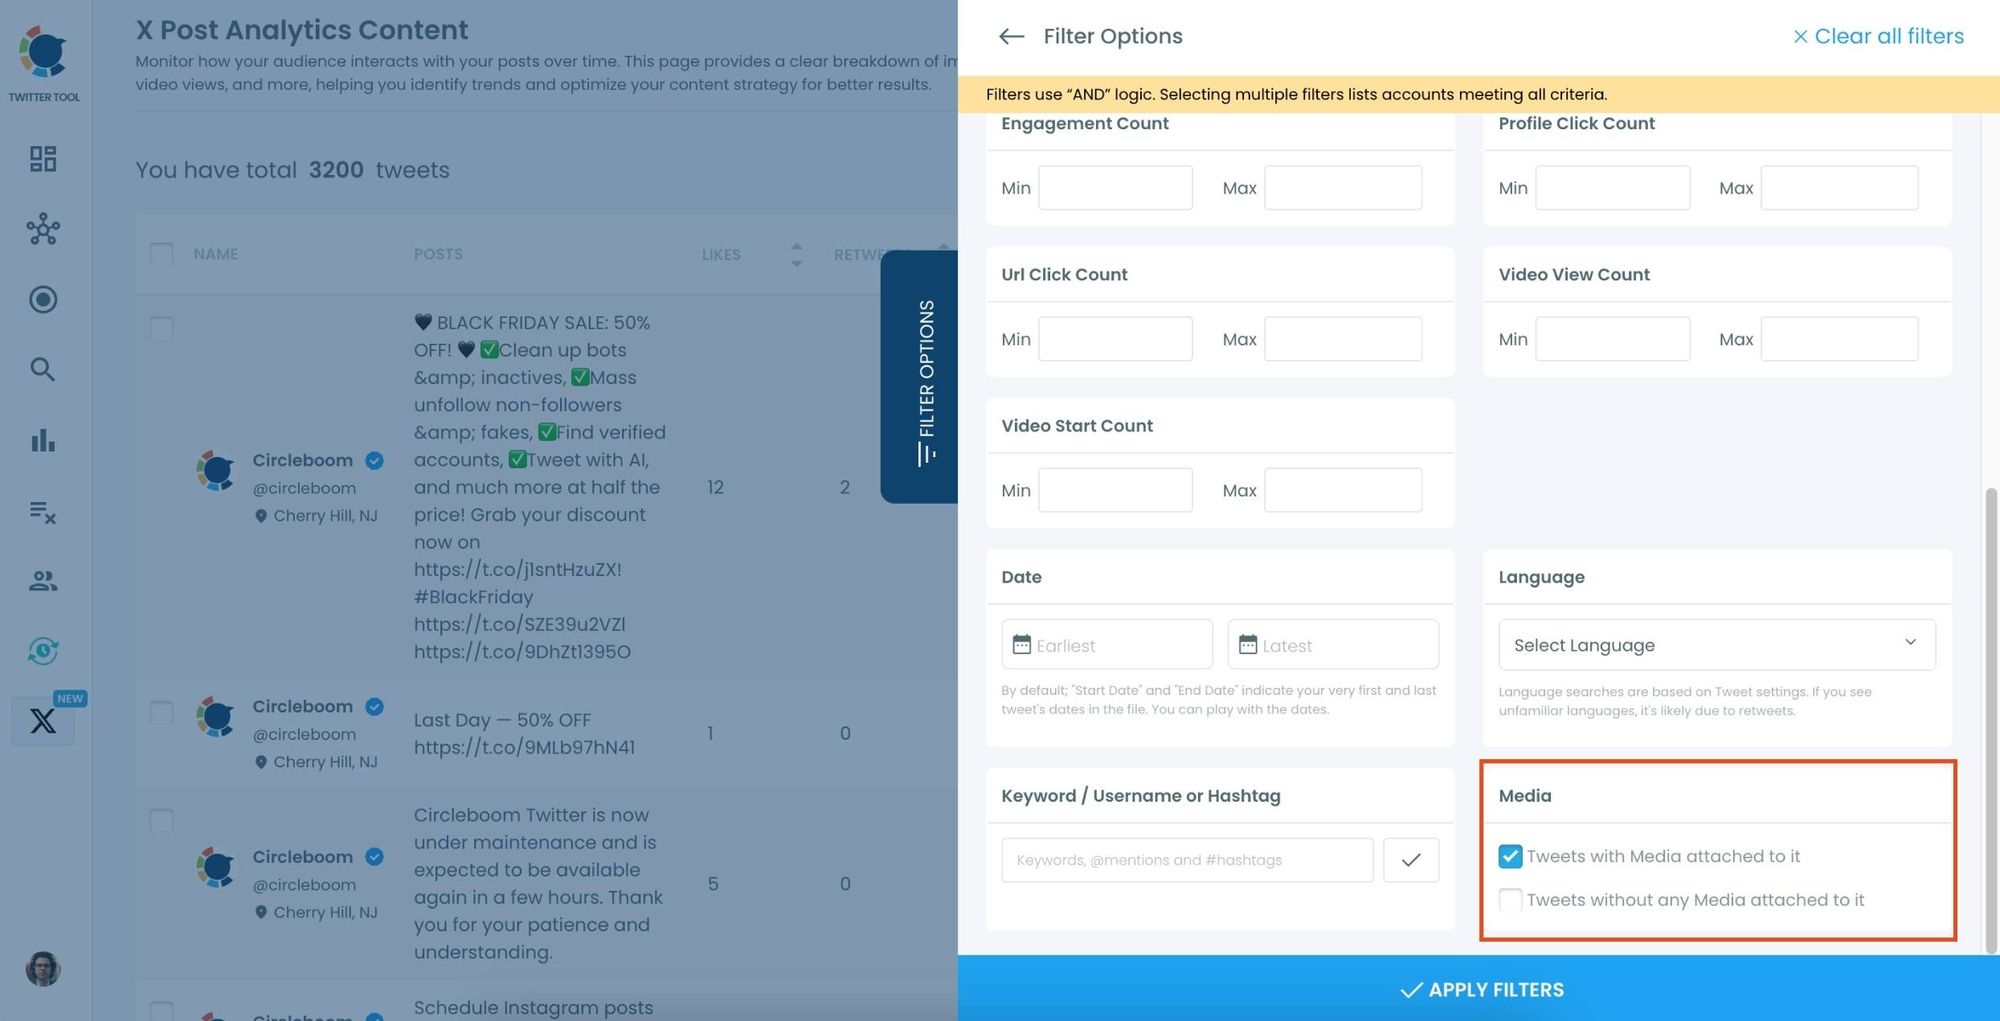
Step #3: Use Advanced Filters (Optional)
For a more focused analysis, click on the "Filter Options" button. You can refine your search by metrics like date, engagement type, or other performance indicators to identify specific trends.
Or you can select media filter to see just your metrics of tweets with media.

Conclusion
You have learned how to check analytics on Twitter with Circleboom without Premium!
Analyzing your Twitter performance is essential for growing your account and engaging your audience effectively. While Twitter’s built-in analytics are helpful, Circleboom Twitter offers a more comprehensive, user-friendly, and cost-effective solution.
Try Circleboom for free and take your Twitter strategy to the next level. With its advanced analytics and additional features, you’ll have everything you need to succeed.


