Small teams rarely have an analyst, so most attempts to compare content strategy end as a feeling about a rival's timeline. That feeling then turns into a plan nobody can check.
This working method gives you two recorded columns and one written test for next month, which is a result you can check.
Manual: a week of scrolling and counting, with no shared date and no way to see what each post earned. Circleboom: lets you compare content strategy for two X accounts in one dated report, using records pulled by an official X Enterprise Developer company.
→ Line up two accounts' formats and leaderboards to build your next content test
Budget one hour for the reading, and leave with one test.
Why comparing two X accounts by eye produces the wrong plan
Comparing two X accounts by eye produces the wrong plan because it merges two different questions: what the account publishes, and what performs for it. A timeline shows the first and hides most of the second.
The mistake I see most often is copying the most visible habit. A rival posts plenty of video, so video goes on the plan, and nobody checks whether those videos earned more than the rival's plain posts.
Hand counting does not fix this, because each number gets gathered differently and comes from an unknown number of posts.
A better starting point is a single report that lets you compare content strategy on the same basis, with every panel showing both accounts.
You also need the right second account. Pick a direct peer that shares your target market, language, rough scale, publishing purpose and business model.
A category leader is useful for studying approaches, but its totals make poor targets for a small team.
What the report gives a small team to work with
Circleboom's X Competitor Analysis tool lets you put two X accounts side by side across 9 report sections, with your own account in one slot or two other public accounts. For this method, you only need four of them: Content Type & Format, Posting Behavior, Engagement and Content Leaderboards.
Three facts decide whether your pair qualifies:
- Both accounts must be public.
- Neither can have more than 3,000,000 followers.
- Tokens are charged per competitor per report, and your own account never uses one, so you plus one rival costs 1 token.
Circleboom retrieves the source records as a verified Enterprise partner of X, so the numbers you record come from official records, with no scraping behind them. That is a real comfort when someone asks where a figure came from.
Once your pair qualifies, you can run a content strategy comparison for the two accounts right away.
To preview the panels first, open the sample report, which covers the public accounts of Visa, Mastercard, PayPal and American Express.
How to compare content strategy of two X accounts, step by step
Eight actions in three phases, with each phase feeding the next.
Put both accounts in one report
- Log in to Circleboom Twitter and connect your X account.

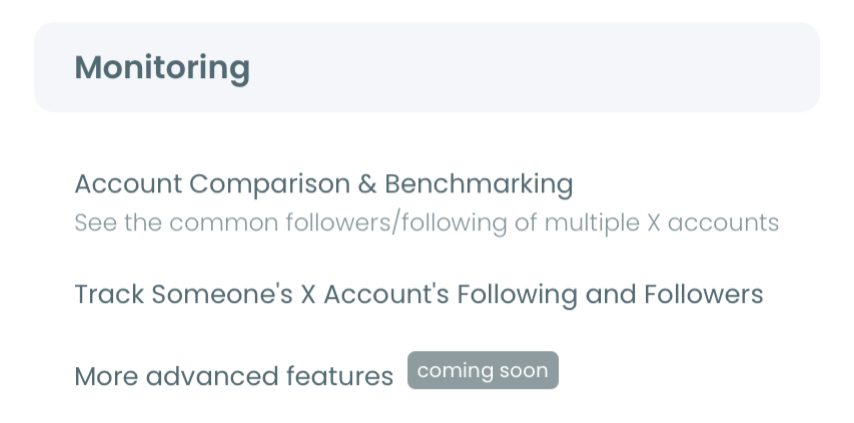
- Open the Monitoring menu and select the competitor benchmark report.
- Enter the two handles under Account Handles, press Start Competitor Analysis and choose Just this once for a first run.
Check the pair, then record what each account publishes
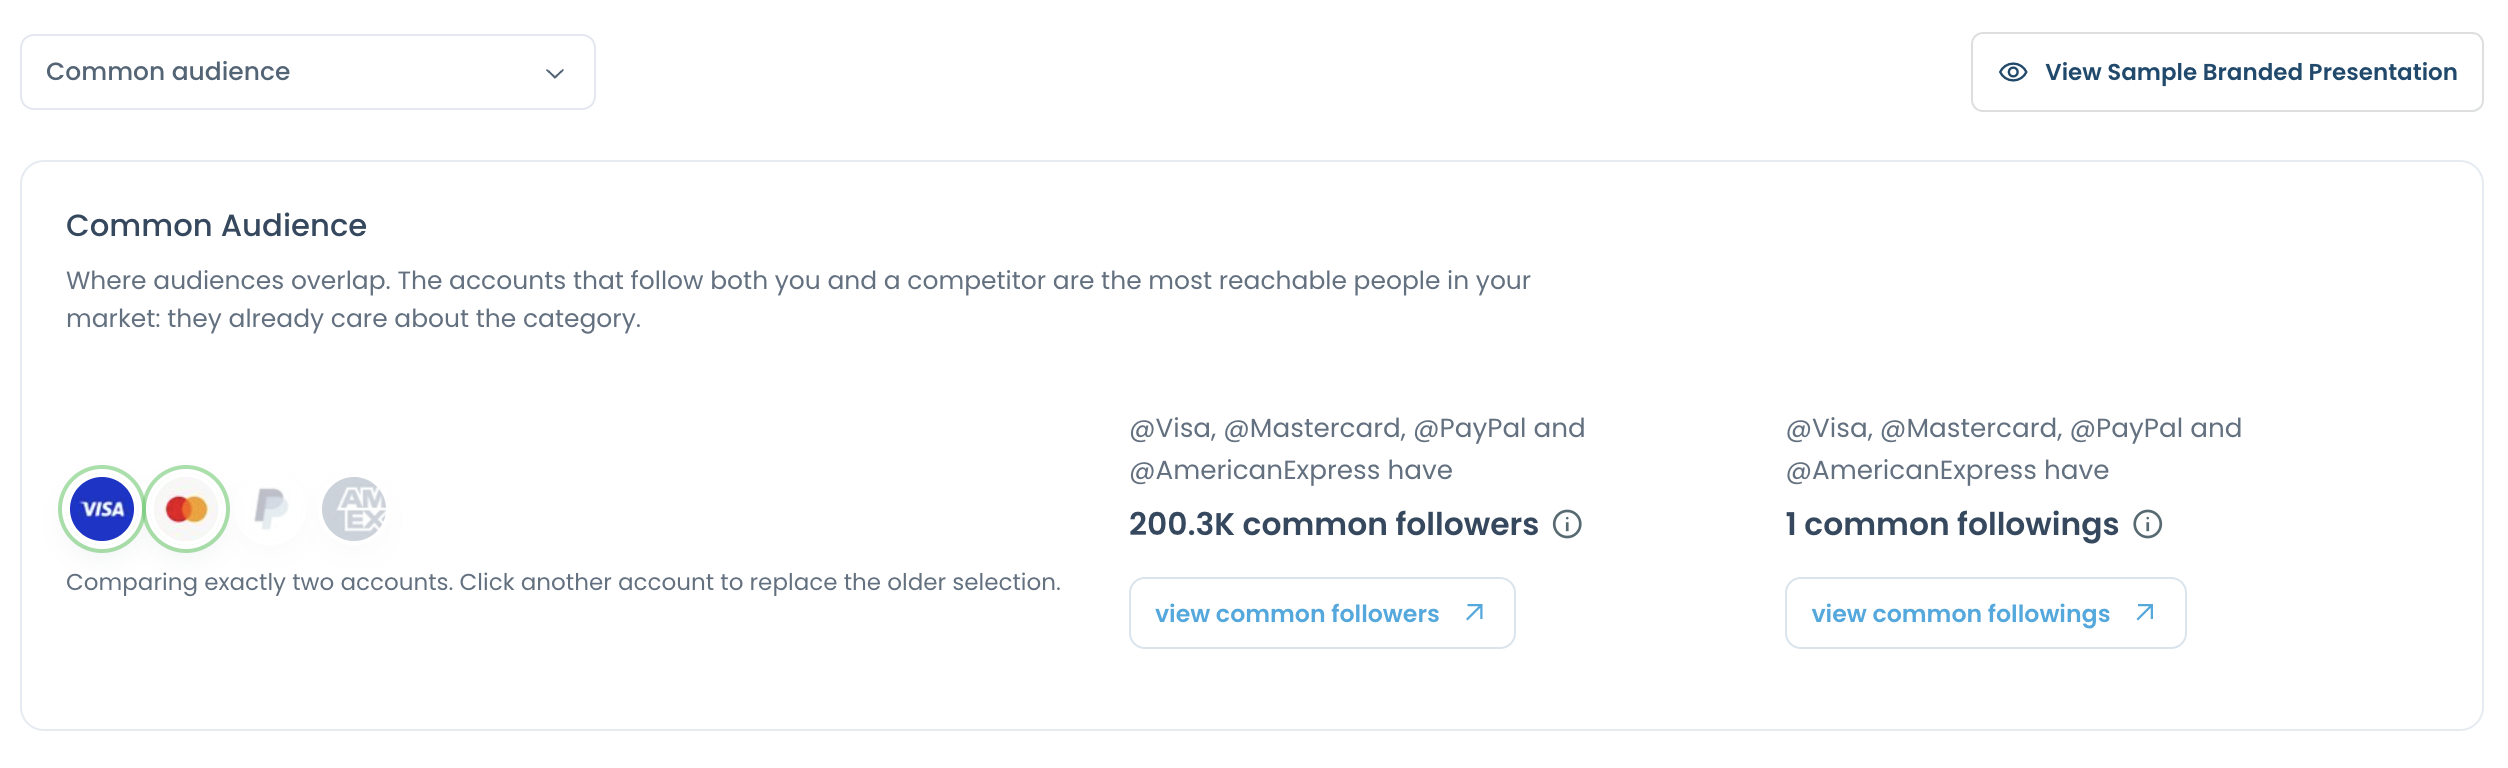
- Check the Common Audience panel with both accounts selected, because shared followers and followings tell you whether this pair competes for the same people.
- Note the original, reply, repost and quote split for each account, and stop here if one of them is mostly replies.
- Note the format mix, link and media share, post length range and cadence, writing them in two columns.
Record what performed, then write the test
- Read average engagement per post and engagement rate in the Engagement summary, then open the four Content Leaderboards and mark any pattern that repeats.
- Write one test in this form: for the next month, we will change one thing, on these topics, and judge it on this per-post number.
That order records effort before results, which keeps the look of a timeline out of the numbers. It ends on one sentence because a test nobody wrote down never gets checked.
Two accounts, one date and one test is a method a small team can repeat every month.
Short demo: how to read impressions and engagements post by post, the habit that step 7 depends on.
A worked example of the two columns
The table below is an illustrative example, with figures inside the ranges the report documents, of what your two columns can look like after step 7.
| What you record | Account A | Account B |
|---|---|---|
| Video share of posts | 25% | 5% |
| Typical post length | 16 to 610 characters | 40 to 120 characters |
| Posts per day, last 30 days | 5 | 1 |
| Average engagement per post | 14 | 40 |
| Engagement rate | 0.4% | 1.2% |
Say you run Account B. A's video habit looks impressive on the timeline, and the columns show it is not earning more per post.
You would not fund a video line from this. You might test A's shortest posts instead, if the leaderboards show those posts repeating.
That is what the method buys you: one specific, cheap test in place of one expensive imitation.
Write the test so the next report can check it
A good test names one change, one topic set and one per-post number, because those are the three things you can read again in the next run.
From the table above, it could read: for the next month, Account B will publish two posts a week under 120 characters on its two strongest topics, judged on average engagement per post.
Three things make a test fail, and all of them come from trying to compare content strategy in general instead of one decision:
- Changing format and timing together, so a result cannot be traced to either.
- Judging it on monthly totals, which move with post count.
- Targeting a number from a category leader whose resources you do not have.
Keep the sentence in the same document as your two columns. When you compare content strategy again next month, the old test is the first thing you read.
Does your rival lead on content or only on output on X?
Check the per-post average against cadence, because a lead on totals can come entirely from volume. Every interaction column in the Engagement summary is a per-post average, and the month-by-month charts hold the totals.
So 8,000 engagements from 400 tweets and 2,000 from 100 tweets are the same 20 per tweet.
If your rival leads on totals and matches you per post, they lead on output, and closing that gap costs a posting queue rather than a creative rethink.
Engagement rate needs the same care. It is total engagement divided by total impressions, so it describes how often people shown a post interacted with it, and it does not describe interaction relative to follower count.
Read it with average impressions, because a high rate on a few displays and a lower rate on many displays are different findings.
Can you do this by exporting both accounts' tweets to a spreadsheet on Twitter?
Yes, and it suits one specific job: looking at posts the report's panels do not sort the way you need. Export Tweets downloads up to one public account's last 3,200 tweets as a CSV, and that export uses no tokens.
Each row carries the post's date, language, impressions, likes, replies, retweets, quotes, bookmarks, tweet type, media flag and text.
A spreadsheet lets you tag posts by topic, which the report does not do for you.
Threads need hand reading too, since the report has no thread usage rate and its format mix covers only text, image, video and poll.
The trade-off is that you build everything else yourself:
- Format and length calculations, once per account.
- Per-post averages and rates on a shared date range.
- Any view of when each audience is online, since the file holds tweets only.
I would run the report first and export only when the test you wrote depends on topics. That keeps the spreadsheet work attached to a question.
How to turn what you found into next month's content plan
Turn the finding into a plan by giving the one test a slot in the calendar and leaving the rest of the plan alone. The largest actionable gap gets one action, and everything else waits for the next run.
Start from your own side. A rival's top post is a hint, while your own Twitter content performance analysis shows which of your posts work best and what your baseline is.
Then place the test on a real schedule. A Twitter content calendar keeps it from being crowded out. X Post Planner can then queue the posts so a busy week does not break the test.
Is your test about topics and not formats? Tweet Mapper for strategic social media planning helps you see where your subject matter clusters before you commit to one.
Bookmark data deserves a separate look. If a rival's bookmark leaders are step-by-step posts, that points to reference content.
Checking your most bookmarked tweets tells you whether your audience saves the same kind of thing.
What a second report can and cannot tell you
A shift between two runs does not prove your strategy caused it. Re-running a report refreshes a rolling sample, so a changed average can reflect new posts, older posts leaving the sample, or extra interactions on posts that stayed.
Look for the same direction in more than one section before claiming anything, and read per-post averages before monthly totals.
Keep the second account fixed, too, since a swapped peer is a different comparison and not a change in your position.
If you want the runs to arrive without anyone remembering, Keep it up to date every month produces a report now plus monthly ones. On a 12-month schedule that is 13 reports, so you plus one rival costs 13 tokens, and two other accounts cost 26.
Which move fits what your comparison found on X
Your next move depends on what the two columns showed when you compared content strategy, so pick the branch that matches. These are the decisions I would make from each result:
- If the gap is volume (same per-post average, fewer posts), test a steadier queue before you touch the content.
- If the gap is per post (similar output, lower average), study the rival's repeating leaderboard patterns and test one in your own voice.
- If the gap comes from one post (a standout far above the average), treat it as an example and change nothing yet.
- If the rival is mostly replies, pick a different second account, since you are looking at a support desk.
- If nothing separates you, read the Followers view of audience quality next, because the content may not be the problem.
Whichever branch you land on, you leave with a test small enough to run and specific enough to check.
Circleboom's standing on X's Enterprise customer directory covers the sourcing question when someone asks.
The rest is one report and one sentence.
→ Compare two accounts' content and write your first test
Common questions on comparing two accounts' content: a short FAQ
Can you work out a competitor's content strategy just from their account?
You can work out what they do, but not why. The format, tweet type and cadence panels show repeated decisions, so treat a finding as something to test and never as their stated plan.
How far back can I compare two accounts' posts?
Up to about 3,200 recent tweets per account, which is a rolling sample and not full history. Check the post dates for both, since a frequent publisher's sample covers a shorter period.