

Your following count is not a fixed number; it moves every time you follow or unfollow an account. Most people never watch that movement, so they miss the story it tells: the following sprees, the cleanup runs, the slow drift toward the 5,000 ceiling. To track your Twitter following count over time, you need a chart of that history, not just today's total.
Circleboom records your following count at regular intervals and charts it over time, with a trend view and a daily-change view, so you can see exactly how your following list has grown and shrunk on X.
→ track your Twitter following count over time
Below: what the curve reveals, and how to read it....
What Tracking Your Following Count Reveals
Tracking your following count turns a single number into a history you can read. Instead of seeing only that you follow 1,200 accounts today, you see how you got there: a sharp climb last spring, a flat stretch over summer, a drop when you ran a cleanup. The shape of that line is the shape of your own behavior.
That history answers questions a snapshot cannot. Did your last unfollow session actually reduce the count, or did you drift back up? Are you following accounts faster than you are pruning them? A trend line makes those patterns obvious, where a single total hides them completely.
The point is self-awareness. You manage what you measure, and a following count you never chart is a number you are not really managing at all.
Why X Won't Show You This
X shows you the current number and nothing else. There is no native history of your following count, no chart of how it changed, no record of the day you added forty accounts or the week you cleaned out a hundred. The platform gives you a snapshot and discards the timeline.
Even the analytics X does provide focus on post performance, not on the shape of your network over time. Its post activity dashboard tells you how tweets did, not how your following list evolved. The follow side of your account is left entirely untracked.
That gap matters because following behavior is strategic. The accounts you follow shape your feed and count against a hard ceiling, so watching how that number moves is part of running the account well, not a vanity exercise.
The Two Views: Trend and Daily Change
Circleboom charts your following count two ways, and each answers a different question. The Performance view is a trend line that shows the overall direction: are you steadily adding follows, holding flat, or pruning down? It is the big-picture read.
The Daily Change view is a bar chart of net movement per day. It shows the spikes, the day you went on a following spree and the day a cleanup pulled the number down. Where the trend line shows direction, the daily bars show events.
Reading them together is the trick. The trend tells you where your following is heading; the daily change tells you what specific actions drove it there. A rising trend made of small daily additions is healthy growth; a jagged one made of big spikes and drops usually means impulsive following followed by regret.
What Your Following Curve Is Telling You
Once you can see the curve, the patterns interpret themselves. A long, steady climb with no pruning often means you are accumulating follows without ever cleaning up, which is how lists rot and feeds go stale. A sawtooth pattern of climbs and cleanups is healthier, because it shows active maintenance.
A curve flattening near a high number is a warning. Every X account can follow up to 5,000 before the platform restricts further follows based on your ratio, so a following count creeping toward that ceiling is a signal to prune before you hit the wall.
The most useful read is the relationship between your follows and your goals. If your following is climbing but your engagement is not, you are following the wrong accounts, and the curve is the first place that mismatch shows up.
How Circleboom Tracks It Safely
Circleboom is an official X Enterprise Developer company, so it records your following history through sanctioned access rather than scraping. Your account stays safe, and the data is accurate because it comes from authorized profile reads, not a partial scrape.
The tracking is passive and read-only. Circleboom samples your following count at regular intervals, calculates the daily change, and charts both, all without touching your account state. You can export any view as a PNG, JPG, or PDF when you want a record or a report.
Watch how to pull your Twitter growth stats over time:
How to Track Your Twitter Following Count Over Time
The setup takes a couple of minutes, and the history builds automatically from there. Follow the steps in order.
- Log in to Circleboom Twitter and connect your X account with secure OAuth.
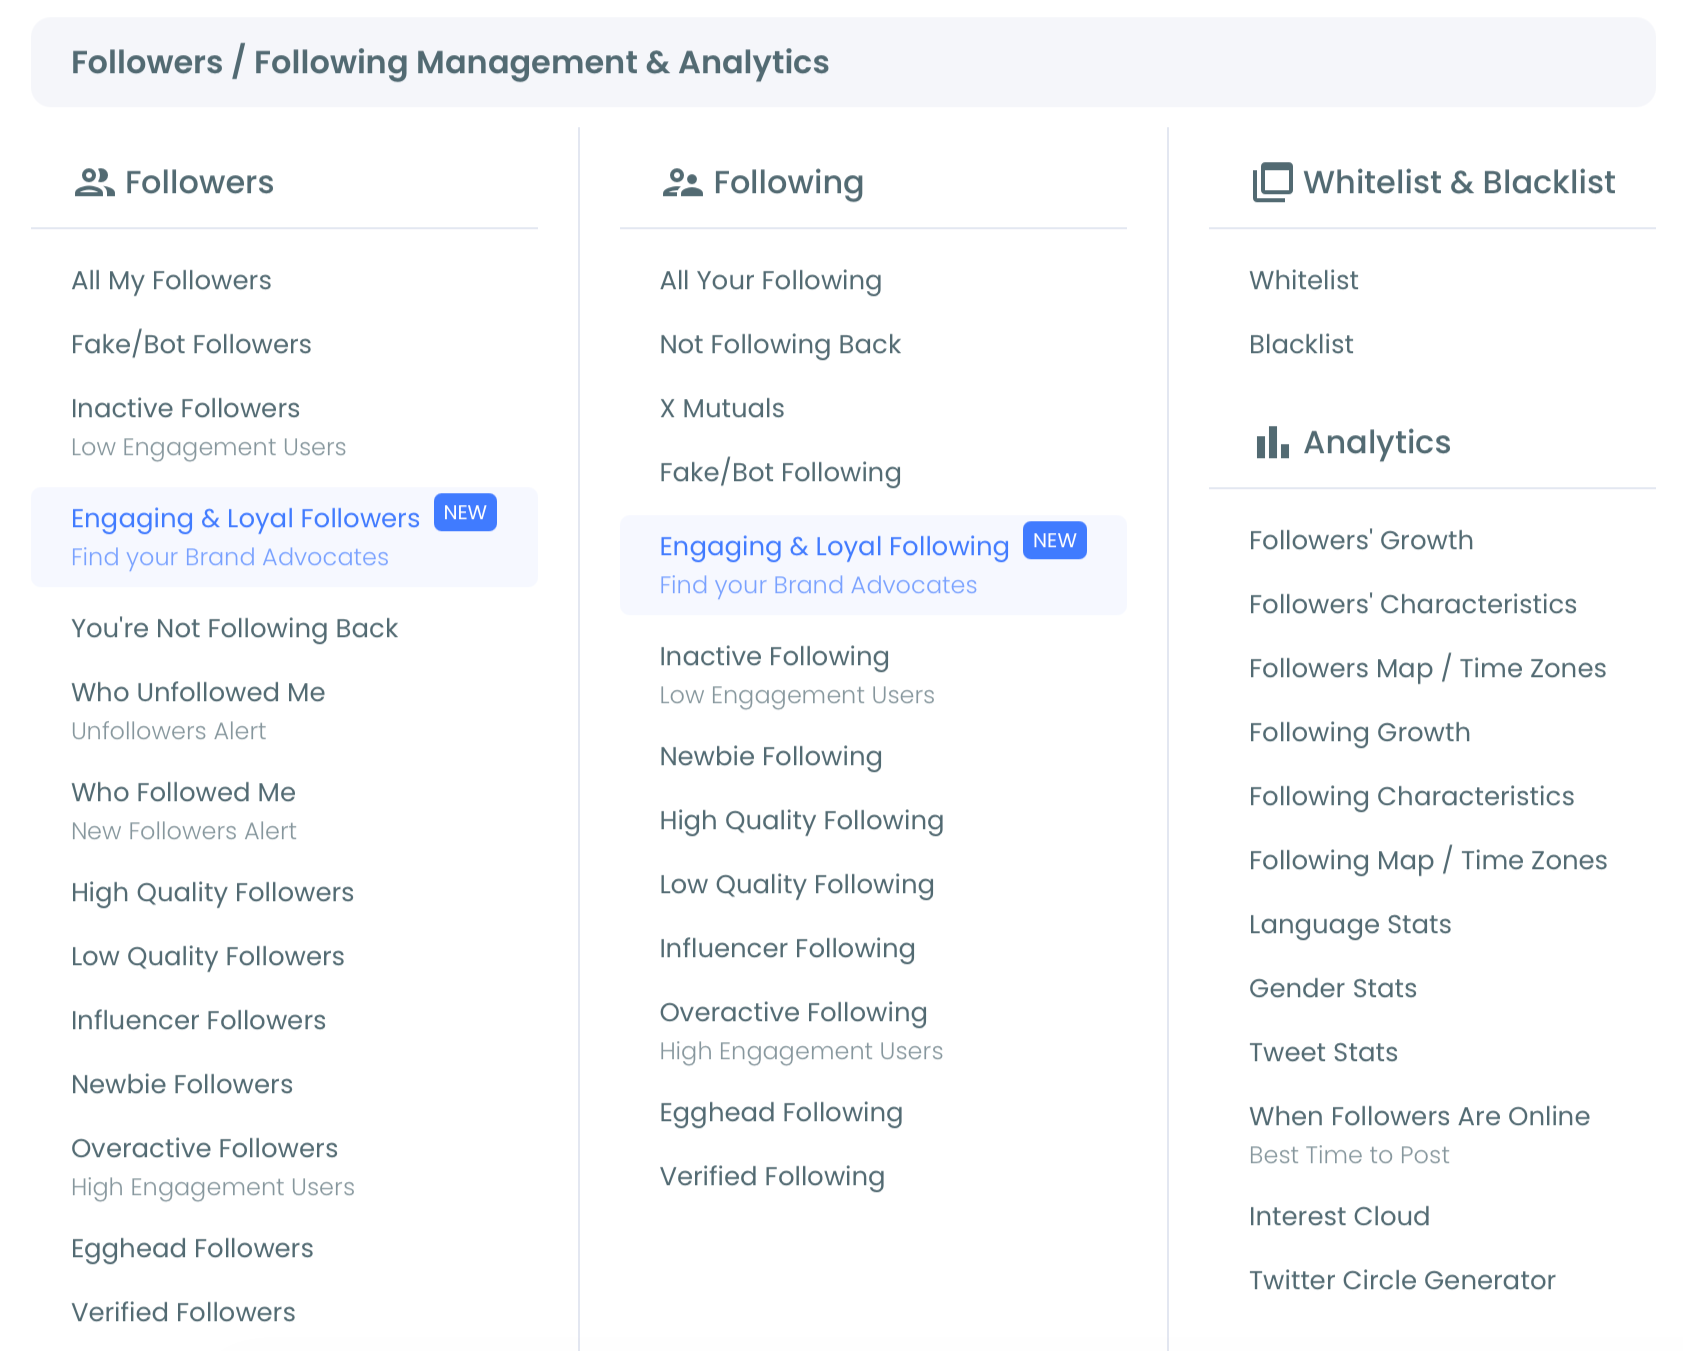
- Open the Follower and Following management and analytics menu to reach the growth tools.
- Open the Following Growth view and switch between the Performance and Daily Change tabs.
- Adjust the time frame and export the chart for your records.
Because Circleboom keeps sampling over time, the longer you track, the richer the history becomes, which is exactly what you want for spotting slow trends a daily glance would miss.
Turn the Trend Into Better Habits
A chart is only useful if it changes what you do. The clearest payoff is pacing: if the daily-change view shows impulsive following spikes, you can switch to adding accounts deliberately instead of in bursts. Steady beats spiky for both feed quality and account health.
The trend also tells you when to prune. A following count climbing without a matching cleanup is your cue to audit, the way the routine in tracking your followers daily, weekly, monthly builds a regular rhythm. To understand the churn, why people follow then unfollow explains the patterns behind the bars.
Tie the number to outcomes, too. If growth is the goal, the tactics in growing an X audience from zero to ten thousand give the curve something to aim at, and a follower growth stats view adds the follower side of the picture.
Keep an Eye on the Number That Matters
Tracking is a habit, not a one-time look. A following count checked once is a data point; a following count charted over months is a trend you can act on. The value compounds the longer you watch it.
Pair following growth with the rest of your audience tracking for a full view. Watching who unfollowed you and reading a deeper follower analysis connect your follow behavior to how your audience responds. The roundup of Twitter follower trackers shows how the pieces fit.
The accounts you follow are one of the few levers you fully control, and a chart of how that number moves keeps the lever in your hand instead of drifting on autopilot.
The Bottom Line
Your following count is a moving number with a story, and X throws that story away the moment it updates the total. Tracking it over time recovers the history: your sprees, your cleanups, your drift toward the ceiling, all in one chart.
Watch the trend, read the daily change, and let the curve guide how you follow and prune.
→ Start tracking your following count with Circleboom
Questions Readers Ask
Does this track accounts I follow or accounts that follow me?
The Following Growth view tracks your following count, meaning the accounts you follow. It charts how that number changes as you add and remove follows over time, which is the side of your account you fully control.
Will tracking start showing history from before I signed up?
Tracking builds forward from when you connect your account, sampling your following count at regular intervals. The history gets richer the longer you track, so the best time to start is now, even if the first few days look sparse.
Can I see exactly which day I followed or unfollowed accounts?
The Daily Change view shows net movement per day as a bar chart, so you can see the days your following count spiked or dropped. It reveals the size of each day's change, which is usually enough to connect a spike to a following spree or a cleanup.
Is tracking my following count safe for my account?
Yes. Circleboom only reads and charts your following count through sanctioned access, and the tracking is passive. It never follows, unfollows, or changes anything, so there is no risk to your account from simply watching the number.