Nine report sections, up to 5 accounts, up to about 3,200 recent tweets per account: those are the scale figures of Circleboom's X benchmark report, and they give you a yardstick for any tool on your shortlist.
A Twitter account comparison tool is worth paying for only if it can say where its numbers came from and whether they share one basis.
What separates one Twitter account comparison tool from another?
Five things: data source, same-date basis, audience classification, dated re-runs and sample depth. With Circleboom, you can compare up to 5 X accounts across 9 sections using official X Enterprise APIs, so each criterion below has a concrete answer to check others against.
→ Check your shortlist against a full Twitter account comparison report
How I built these criteria: I started from the questions a buyer has to answer after the purchase, and the last column comes from Circleboom's own documentation, checked in October 2026. I did not test or score other vendors, so these are checks for you to run on any tool, not a ranking.
A buyer's shortlist usually gets sorted by the wrong thing: chart count, price, or how good the demo looks.
Those differences disappear the first time a client or a CFO asks how a figure was obtained.
I would sort on the criteria below instead. You can compare X accounts across all five criteria in one report to see what a passing answer looks like.
Twitter account comparison exists to support a decision, such as a budget, a creator contract or a content plan. So the useful test for a tool is whether its output survives someone else's questions.
The five criteria at a glance
Read this table as what to ask a vendor, with the answer Circleboom gives in the last column:
| Criterion | What to ask | Circleboom's answer |
|---|---|---|
| Data source | Where do records come from? | Official X APIs, no scraping |
| Same-date basis | Are all accounts pulled together? | One run, all accounts at once |
| Audience classification | Is composition measured? | Bot, inactive, overactive, tiers |
| Dated re-runs | Can I repeat the same set? | Saved set, dated runs, monthly option |
| Sample depth | How many posts per account? | Up to about 3,200 recent tweets |
A tool that can't answer the first two rows can't support a decision, whatever else it charts.
The sections below take each criterion in turn, and sample depth sits with the same-date basis because the two are read together.
Does the X comparison data come from scraping?
No. Circleboom's comparison data comes from official X API records, and it is retrieved by an official X Enterprise Developer company.
Every figure in the report is calculated from those records, and none of it is scraped.
The source matters for accuracy, not just compliance. X does not permit scraping without its prior written consent, and scraping-based collection can miss tweets, accounts or entries, which leaves a report with incomplete fields you can't see.
When you evaluate any tool, ask which records it retrieves and how. That is a question about method, so it applies to every vendor equally.
One distinction helps when you read any report. Retrieved fields, such as a follower count, come from X. Classifications, such as suspected fake or a quality tier, are Circleboom's analysis calculated from those records, not verdicts issued by X.
A vendor that blurs those two categories is overstating its evidence.
Why same-date basis and sample depth decide whether numbers can sit together
A same-date basis means every account in the set is pulled in one run, so the columns describe the same moment. In Circleboom, each run fetches followers, following and recent tweets for all accounts at once, and there is no per-account or per-section refresh.
Hand-built comparisons fail here first. A week of counting posts, likes read off a timeline and an audience description from memory give you figures gathered in different ways, and the first "do these periods match?" ends the conversation.
A precise buyer should also ask what same-date does not promise. The sample is the most recent tweets, not full history, so the same number of posts covers a shorter period for a frequent publisher than for an occasional one.
A good report lets you check the post dates and the metric basis before you quote a figure. In this one, engagement summary columns are per-post averages, and period totals appear only in the over-time charts.
Audience classification is the criterion free tables skip
Audience classification separates a follower count from a description of who is behind it. The test is whether a tool measures composition per account, with both percentages and raw counts you can open.
Circleboom's Audience Quality section applies the same panels to every account in the set:
- Human vs suspected fake or bot.
- Active vs inactive, based on average tweeting frequency.
- Ordinary vs overactive.
- Verified, by badge type.
- High, Medium and Low quality tiers.
Count and list drill-downs sit behind those shares, which makes the percentage auditable.
These are review signals, and an account that rarely posts may still read everything, so a good tool presents them as analysis rather than a verdict.
The sample report on public accounts of Visa, Mastercard, PayPal and American Express shows why this criterion earns its place. Bot share spread from 20% to 34% across the four, and the High tier from 2% to 17%, with the largest follower list holding the smallest High tier.
A follower table would have ranked that account first.
If you want a primer on the method before you buy, this guide to analyze an account's Twitter followers covers the single-account version.
The Following toggle is the check most shortlists miss
A second test: does the tool classify who an account follows, or only who follows it?
Circleboom's toggle switches every audience panel to the following list, and a brand's following list is chosen, so it reads differently from its audience.
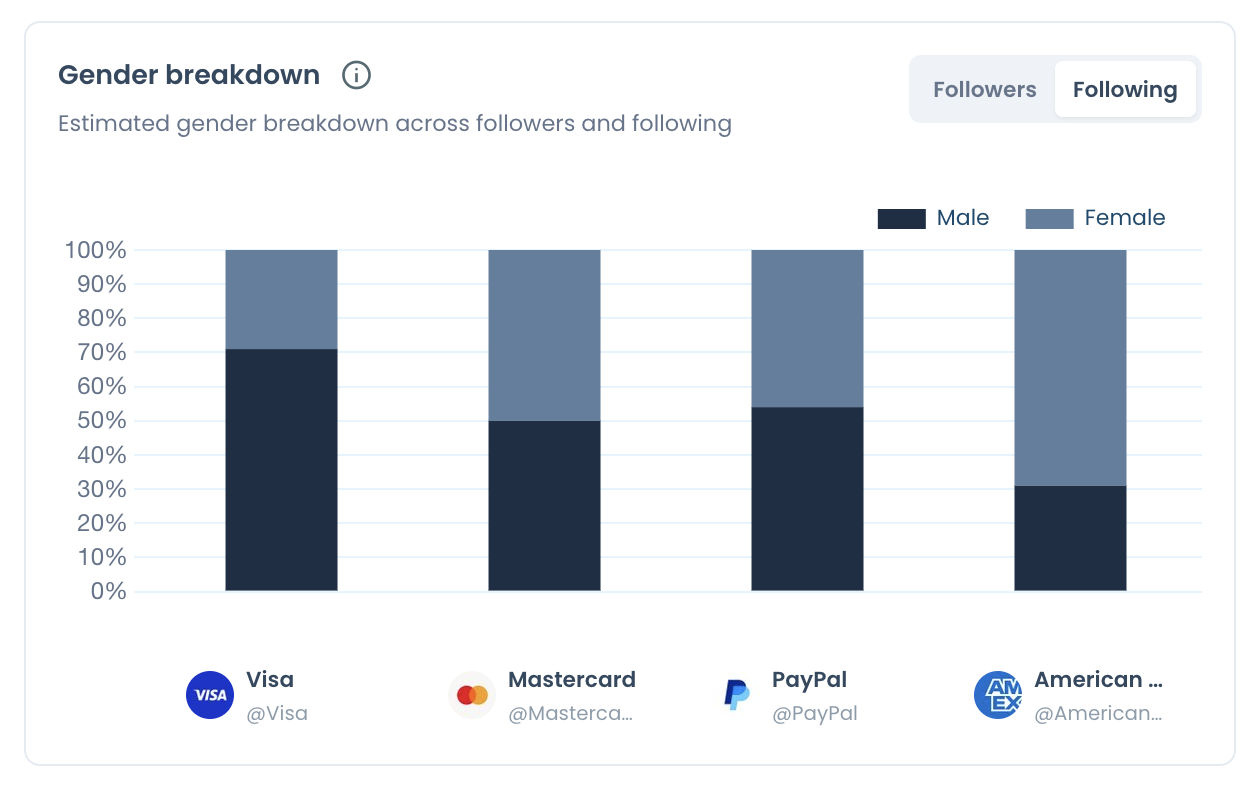
The chart below shows the Following side in that same sample. The male share sits well below its follower-side level for Mastercard, PayPal and American Express, and that kind of contrast only appears when both lists get the same treatment.
Dated re-runs turn one report into a record
Dated re-runs mean a repeat of the same account set produces a new result instead of overwriting the old one.
Ask any vendor what happens to last quarter's numbers when you refresh, because nobody can retrieve a snapshot afterwards that was never taken.
In Circleboom, a saved set keeps earlier runs under Past Analyses. You re-pull with Get a new report with the latest X data, or choose Keep it up to date every month at the start, and a 12-month schedule is 13 reports in total.
I weight this criterion higher than most buyers do. Two runs show a direction, and several runs show whether a change belongs to one account or to the whole set.
A decline across five peers on the same dates is a category move, and a decline in one account is that account's problem. Single-account analytics can't tell those apart.
Rolling samples need honest reading, though. A changed average can reflect new posts, older posts leaving the window, or extra interactions on retained posts, so confirm a direction in more than one section before claiming a cause.
How to run a Twitter account comparison and test these criteria
To run a Twitter account comparison in Circleboom, enter up to 5 public handles, start the analysis, and choose one report or a monthly schedule.
Running one set of direct peers is the most direct way to run a dated Twitter account comparison and test the criteria above against real output.
Four steps cover it.
- Open Circleboom Twitter and connect your X account.

- Go to the Monitoring menu and pick the first item, the competitor benchmark report.
- Add up to 5 public handles in the Account Handles panel, with or without your own account and each with no more than 3,000,000 followers, then select Start Competitor Analysis.
- Choose Just this once or Keep it up to date every month, check the token cost shown against your balance, and confirm.
That order matters because the account set defines what the result can claim. Pick direct peers first, since a set you later swap is no longer the same comparison.
In short: same peers, one run, a dated report, then the same peers again.
When the free Compare X Accounts tool is the better pick
Pick the free tool when your question is only which accounts two profiles have in common. Compare X (Twitter) Accounts takes two usernames, runs in Followers or Followings mode, and returns a filterable list of the shared accounts.
Know its limits before you rely on it. It requires connecting an X account, and on free usage it checks a limited portion of the followings and lists some common ones, so the complete list requires signing in.
The full report answers a different question: performance and composition across up to 5 accounts, with a Common Audience panel for any pair inside the run.
For the overlap side on its own, start with how to check mutual followers on Twitter.
If that overlap is what you plan to act on, Twitter mutuals are worth understanding first.
What to do with an account's follower list after the comparison
Exporting is a separate, token-based step. You can export the list of followers on Twitter as a CSV for any public account.
Each row includes profile fields, counts and flags for egghead, fake, inactive and overactive, and the token use is proportional to the number of accounts in the list.
The report's own recommendation for a follower gap points the same way, since a competitor's followers are a proven audience for the topic.
For your own account, the follow-up is usually cleanup, which is where a Twitter X follower manager to analyze, clean and control your followers fits.
If you want an alert when a compared account follows someone new, track someone's X followers and followings handles that instead.
Objections worth settling before you shortlist
A common objection is "I can just look at their profile."
A profile shows follower count, following count and recent posts. It shows no bot share, no quality tiers, no format mix, no audience geography and no per-post averages, so the honest reply is to name what's missing rather than call profiles useless.
The second is "our competitor is far bigger, so comparing is pointless." Scale differences are what per-post averages and engagement rate against impressions were built for.
The last is about limits:
- Only public accounts can be added.
- Accounts above 3,000,000 followers can't be analyzed.
- The report contains no profile visits or URL clicks in any column.
If those limits don't rule out your set, testing is simple. You pay per competitor per report, so one small run shows you the criteria in practice.
As an official X Enterprise partner, Circleboom can show the source behind every figure.
→ Test a Twitter account comparison on your own shortlist
FAQ: choosing an X account comparison tool
Can a free Twitter calculator handle an account comparison?
For a quick read on one account, yes, but not for a comparison. The free Twitter X Metrics Calculator reads a public account's last 100 posts and measures engagement per follower.
Circleboom's report measures engagement against impressions, so the two rates can't be set side by side.
Is there a single overlap figure for five X accounts?
No, overlap is pairwise. Circleboom's Common Audience panel shows what any two selected accounts share, and this walkthrough to compare Twitter followers between two accounts shows how to read that pair.
How many X accounts fit in one comparison report?
Five accounts per report is the cap on X comparisons in Circleboom, and more than 5 means a second report rather than a wider table. You can keep direct peers in one saved set and category leaders in another, so neither group distorts the other.
How are Competitor Tokens charged on an X comparison?
Tokens are charged per competitor, per report, and your own account never uses one. So 5 competitors once costs 5 tokens, and 5 competitors on a 12-month schedule costs 65 tokens for 13 reports.
See plans and pricing for token options.