

Most Twitter growth tools report that the number went up. Almost none of them tell you whether the accounts behind that number are real, active, or anywhere near your niche, and that blind spot is where growth budgets quietly disappear.
Skip the verification half of the stack and you can spend six months rewriting content against a follower curve that was actually moved by one bot wave and one platform cleanup.
The Twitter growth tools worth keeping split into two jobs: the ones that bring people in, and the ones that tell you who arrived. Circleboom records your follower count as a dated time series on X through sanctioned Enterprise API access, and lists every new follower with quality signals attached, so a gain can be checked instead of assumed.
→ Twitter growth tools
The second layer is the one almost every stack is missing. Here is how to build it.
Why most Twitter growth tools only cover half the job
Growth-tool round-ups are built around acquisition. Scheduling, AI drafting, reply discovery, hashtag suggestions, and best-time-to-post charts all put content in front of more people, and all of them get measured by the same single output: the follower count on your profile.
That count is a terrible instrument. It moves for reasons that have nothing to do with your content.
A follower total can rise while your engaged audience shrinks, because gains and losses happen at the same time and only the net difference reaches the profile. It can fall by hundreds overnight because X removed a batch of spam accounts platform-wide. It can spike after a mention from a large account and then decay for three weeks while you conclude, wrongly, that the format worked.
The audience is quieter than the number suggests
Pew Research Center found that the median Twitter user posts about twice a month, while the most prolific tenth of users produce a median of 138 posts monthly. A follower base is mostly silent by default.
Read the behavior split between highly active and less active tweeters and the implication lands directly on growth measurement. Raw follower additions tell you almost nothing about how many people will ever see your next post.
This is the gap a Twitter Follower Tracker closes. Circleboom keeps a dated log of every follower change on your X account, so a rise or a drop belongs to a specific day rather than to a mood.
It closes the gap by keeping a record you can interrogate later, not by adding another acquisition channel.
I have watched accounts run good content strategies into the ground because nobody kept that record. The same trap catches teams evaluating Twitter automation tools that save you time. Automation works exactly as advertised, output goes up, the follower line goes up, and nobody can say which of the four changes made that month was responsible.
The two layers of a Twitter growth stack that holds up
A growth stack has an acquisition layer and a verification layer, and only one of them shows up in tool comparisons.
Layer one: the tools that bring people in
Acquisition tools put your account in front of accounts that do not follow you yet. Publishing cadence, thread formats, native video, reply targeting, list monitoring, and audience search all live here, and they are genuinely where growth originates.
They share one property, though. Every acquisition tool is a hypothesis generator. It proposes that a format, a topic, or a posting window will attract the right people, and it cannot confirm the proposal on its own. The tactical layer of that work is well covered already, including the daily habits that gain more followers on Twitter organically.
Layer two: the tools that tell you who arrived
Verification tools answer the question acquisition tools cannot: what actually landed. Two data structures do the whole job.
- A dated follower time series, so any change has a date and a magnitude.
- A per-arrival account list, so any wave of new followers can be inspected as a group.
With both in place, a growth claim becomes falsifiable. Without them, "our Twitter growth tools are working" is a feeling.
Circleboom's Followers' Growth view keeps the first structure. It records your follower count at regular intervals through X's Enterprise API tier and calculates the daily net change.
The data renders two ways. A Performance chart plots the follower level over time; a Daily Change bar chart puts gains above zero and losses below it.
That is where Twitter Follower Growth Stats earns its place. A spike stops being a rumor and becomes a date you can match against what you posted.
Who Followed Me keeps the second structure. Every new follower appears in a table with tweet count, join date, following count, follower count, follow ratio, and an activity classification, plus filters for fake and spam accounts, verification status, language, and location. A ten-option time window runs from the last day out to the last year.
The pairing is the point. The chart tells you when something happened; the arrival list tells you what it was made of.
The timing constraint nobody prices in
Circleboom starts collecting your follower history at the moment you connect the account. Counts from before that date are not retroactively available, from any tool, because nobody was recording them.
That makes the highest-return move in the whole category a boring one. Connect the Twitter growth tools that keep a dated record before you need the baseline, not during the campaign you wanted to measure.
How to set up your Twitter growth tools step by step
Watch the flow: how every individual new follower shows up as a reviewable row instead of a notification you scrolled past.
https://www.youtube.com/watch?v=gZyRQQKLwq4
The sequence below runs in three phases, and the order matters more than any single step in it.
Connect the account and start the clock
- Log in to Circleboom Twitter and authorize your X account through official OAuth. Collection begins from this moment, which is why doing it before a campaign is worth more than doing it during one.

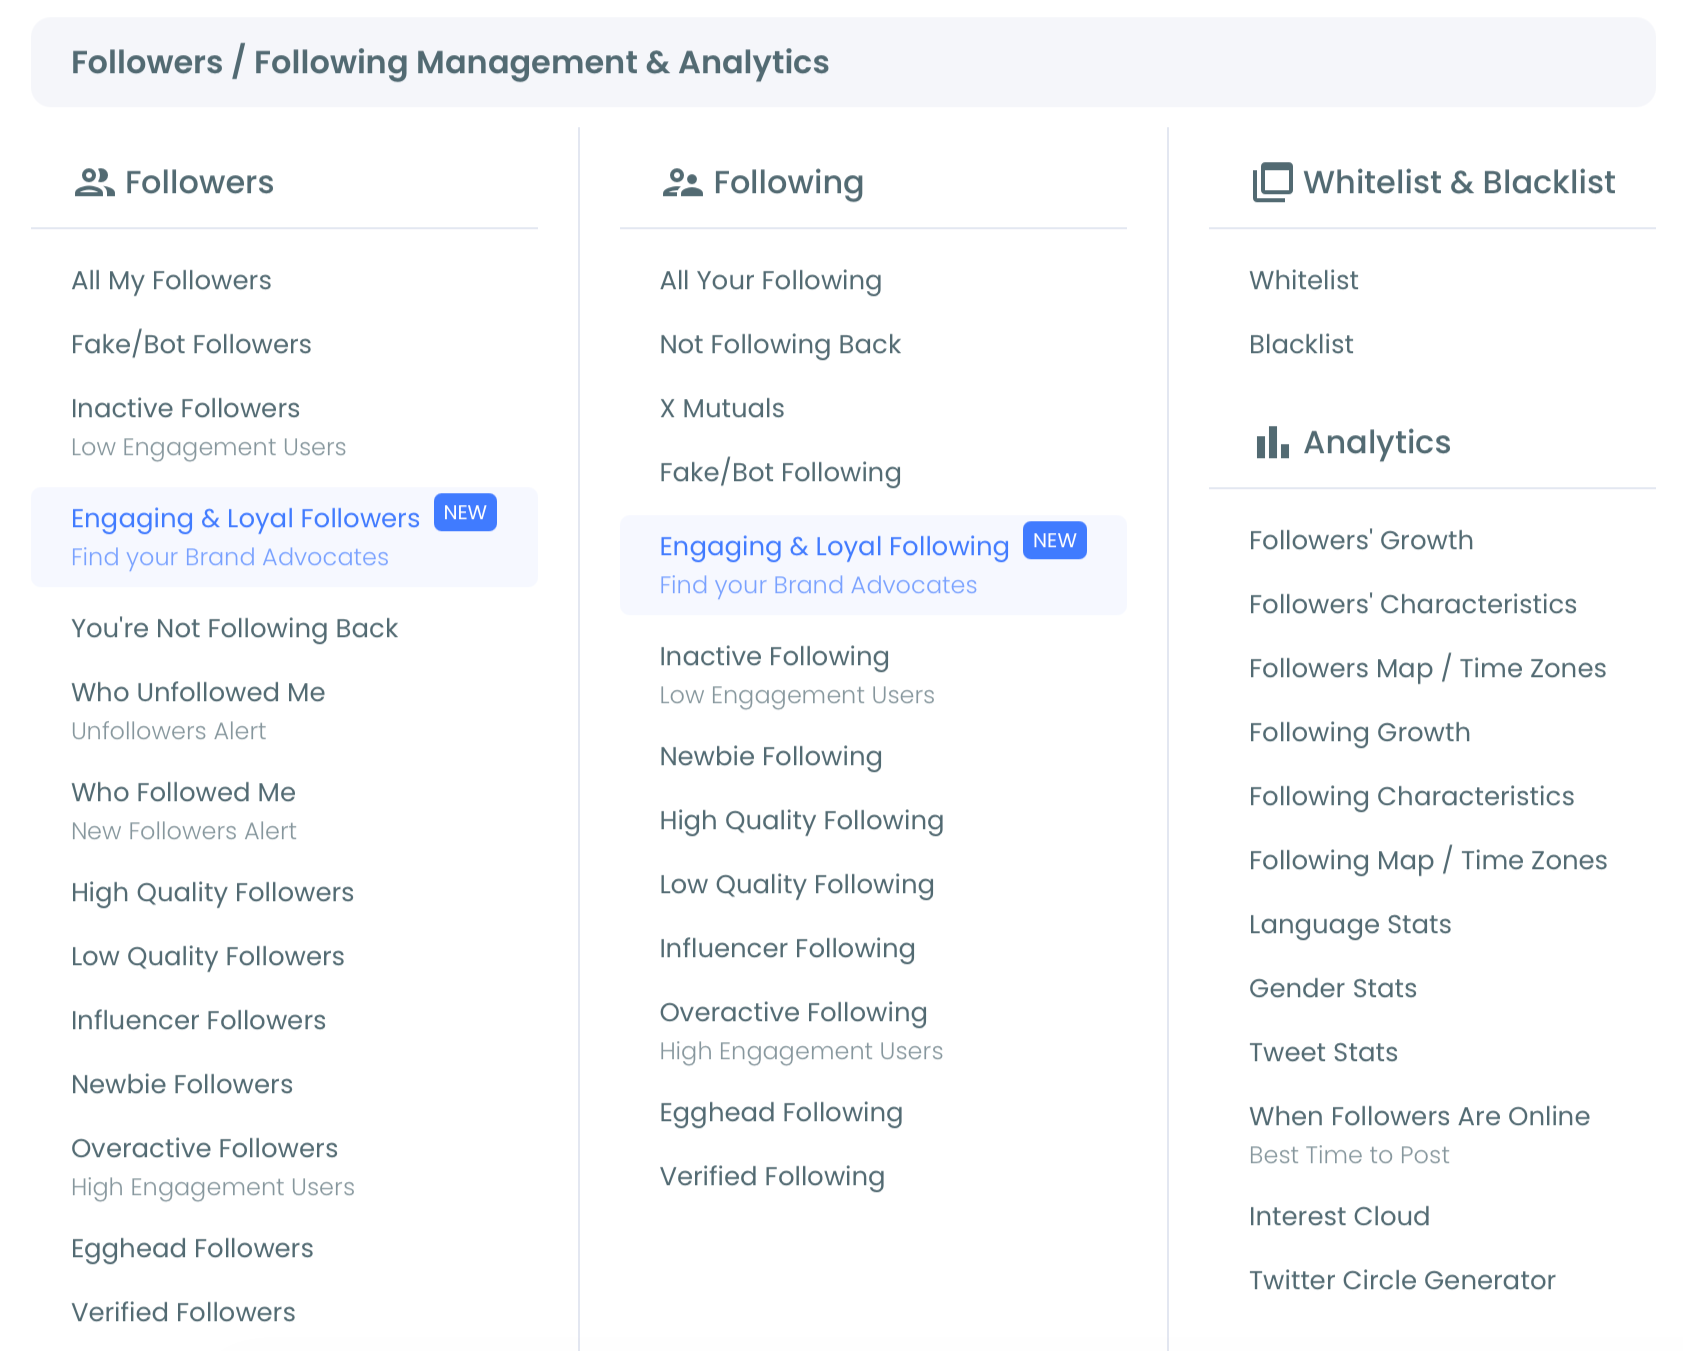
- Open the Follower and Following management menu, where both the growth analytics and the new-follower views live.
- Let the first daily sync complete before drawing any conclusions. Follower data refreshes daily, so accounts that followed you in the last few hours appear after the next fetch rather than instantly.
Read the trend before you read the content
- Open Followers' Growth and switch to the Daily Change tab. The bar chart separates gain days from loss days, which the Performance chart deliberately does not, since it plots the follower level and therefore blends both.
- Drag the timeline selector to the window you care about and write down the dates where bars are unusually tall or unusually negative. Do this before you look at your posting history, so you are matching dates to content rather than hunting for content that flatters a date.
Check the cohort that arrived
- Open Who Followed Me and set the time period to match the spike window. The selector covers the last day, two days, three days, five days, one week, two weeks, four weeks, three months, six months, and one year.
- Apply the Fake and Spam filter, then the Join Date filter, and see how much of the wave survives. A cluster of brand-new accounts with poor follow ratios and near-zero tweet counts arriving inside one short window is the signature of inorganic growth, not a content win.
- Act on what survived while it is still identifiable. Follow back the relevant accounts, whitelist the high-value ones so future cleanups cannot touch them, remove the obvious spam, and export the cohort as a CSV if you need it for campaign attribution.
That ordering is what makes the process hold up. The login starts a record that cannot be backfilled, and the chart narrows a week of noise down to one or two dates worth explaining. The arrival list then turns those dates into named accounts you can act on, while they are still grouped together rather than dissolved into a follower base of thousands.
Quick recap:
- Connect first, so the time series has history when you need it.
- Read Daily Change before reading your own posts.
- Match the Who Followed Me window to the spike date.
- Filter for fake, spam, and brand-new accounts before celebrating.
Is it safe to use third-party Twitter growth tools?
Yes, when the tool operates inside X's own rules rather than around them. The distinction that matters is not "third-party versus native," it is whether the tool reads and writes through sanctioned API access or scrapes and fakes its way to the same numbers.
Circleboom is an official X Enterprise Developer company, listed in X's own directory. Every follow, remove, export, and data pull runs through sanctioned endpoints with platform rate limits respected in the background.
Follow actions process at 50 every 15 minutes, up to 400 per day. Mass removals pause automatically when a limit is reached instead of hammering the API until X flags the account as aggressive.
The category that genuinely puts accounts at risk is the one selling follower counts directly. X's Authenticity policy prohibits buying followers and coordinating engagement to inflate account metrics, with enforcement ranging from anti-spam challenges to suspension. Any tool whose pitch is a number rather than a workflow is pointed at that line.
There is a quieter benefit to the compliant path. Because official API access returns the real account behind each follow, the quality signals in your arrival list are trustworthy. Scraped data cannot tell you whether the account that just followed you has posted in a year.
Three decisions that get better with a record
Growth stops being a mood and starts being a claim you can defend. That shift changes three decisions.
Campaign evaluation gets a baseline. A gain of 500 followers means something completely different against a prior monthly rate of 200 than against a prior rate of 600, and only a pre-campaign trend line tells you which situation you are in. That is also the honest answer to the question behind most searches for Twitter follower tracking: people want the number, but what they need is the comparison.
Engagement diagnostics get a second suspect. When your engagement rate drops with no obvious change in content quality, the growth chart shows whether a large intake of low-quality accounts arrived in the same window. The investigation moves from "my writing got worse" to "my denominator got bigger," which is a different problem entirely, and the one most people misdiagnose.
Cleanup gets cheap. Reviewing a suspicious wave inside its arrival window is a filter and a checkbox. Finding the same accounts eight months later, mixed into everyone else, is an audit. The same logic applies across the broader set of Twitter optimization tools you might run alongside this one: earlier data makes every downstream decision cheaper.
You can also automate the watching. Who Followed Me includes a New Followers Alert that emails a weekly or monthly summary. That lets you check new followers on Twitter without opening the dashboard on days when nothing happened.
The bottom line
Twitter growth tools divide into the ones that add followers and the ones that verify what got added, and almost every stack is built entirely from the first kind. Adding the second kind costs one connection and a weekly ten-minute read, and it converts your follower count from a number you hope is meaningful into a record you can question.
The two pieces are a dated growth chart and an arrival list with quality filters. Together they tell you when your audience changed, by how much, and who was in the change.
Start the record before the campaign you want to measure, not after it.
→ track your Twitter follower growth
Growth stack questions worth settling first
How long before the growth chart is useful?
The chart is readable within a couple of weeks and genuinely diagnostic after about a month, because trend interpretation needs enough baseline days to distinguish a real spike from normal variation. Circleboom cannot show follower counts from before your account was connected, so the dataset only gets richer from the connection date forward.
Why did my follower count drop with no unfollows from real people?
X periodically removes spam, fake, and suspended accounts in bulk, and those removals land on your chart as a sharp negative bar even though no genuine reader left. Checking the Daily Change tab against the date is the fastest way to separate a platform cleanup from an audience reaction to something you posted.
Can I tell whether a viral spike brought real followers?
Yes. Set the Who Followed Me time window to cover the spike, then filter by Fake and Spam status and by Join Date, and the composition of the wave becomes visible as a proportion rather than a guess.
Does removing a follower notify them?
No. Remove Follower quietly drops the account from your follower list without blocking them, so they are not alerted and can technically follow again later. Removals process gradually through the X API, with automatic pauses of one to twenty minutes when rate limits are reached.

