
What counts as a real industry benchmark on X, and what makes it hold up when a stakeholder asks where the number came from?
What are Twitter industry benchmarks?
Twitter industry benchmarks are same-date, same-basis ranges across named peer accounts in one category. With Circleboom, you can compare up to 5 X accounts through official X Enterprise APIs and read each range side by side.
→ Get working benchmark ranges for your X category
Three tests a benchmark on X has to pass
A figure qualifies as a benchmark only when it passes all three of these tests:
- Same date. Every account is pulled in one run, so no figure comes from a different moment.
- Same basis. Every metric is calculated one way, and the calculation is written beside it.
- Named peers. The accounts are listed, so a reader can challenge the set.
Most published industry figures fail at least the third test, which is why they are hard to use in a planning document.
The point of the definition is practical: a marketer who can name the accounts, the date and the formula can answer the follow-up question, and one who cannot has to drop the number.
Circleboom lets you run that comparison on X with one report, and the X Competitor Benchmark Report tool stamps and saves every run. If you already know your peers, you can compare your category's Twitter industry benchmarks right away.
I treat a benchmark as a range rather than a single figure. A range across five accounts tells you what normal looks like and how much room the category leaves, while an average hides both.
It also keeps small business marketing on Twitter honest, since a small account can sit inside a peer range even when it looks tiny next to the sector's giants.
Each benchmark metric needs its stated basis
A benchmark figure is only as defensible as the sentence that says how it was calculated.
The same word can hide different arithmetic, and the X Competitor Benchmark Report tool has several metrics whose unit is easy to misquote:
| Metric | Stated basis | Common misreading |
|---|---|---|
| Engagement summary columns | Per-post averages | Period totals |
| Engagement rate % | Engagement over impressions | Per-follower rate |
| Average impressions | Across the analyzed sample | Monthly total |
| Hashtags | Per 500 tweets | Per tweet |
| Active followers | Average tweeting frequency | Who reads the posts |
A hashtag value of 105 means roughly one hashtag every five posts, which shows how far a missing unit can mislead.
Posting consistency has the same issue, since it prints as a label plus a CV number, such as "Burst · CV 3.40," and a higher CV only means spikier posting.
Coverage needs a line of its own too. The pull is capped at up to about 3,200 recent tweets per account, so the same number of posts can span a short period for a frequent publisher and a long one for an occasional publisher.
Check the available post dates before you claim two accounts share a window.
I write the basis into the sheet as its own column. It feels fussy until the first time a finance lead asks what the rate is a rate of, and then that column is the whole answer.
Which accounts should make up an industry benchmark set?
An industry benchmark set should hold direct peers: accounts that share your target market, language, account scale, publishing purpose and business model.
Industry alone is too loose, since a regional support account and a global entertainment-led brand can sit in one sector and serve different goals.
Three rules keep the set usable:
- Separate leaders from peers. Category leaders are for studying approaches, and their raw totals never become targets.
- State the set type. Say in the report whether you used direct peers or aspirational references.
- Freeze it between runs. If an account is replaced, explain the change, because a different group is not a change in position.
Two limits shape the choice. Only public accounts can be compared, and accounts above 3,000,000 followers cannot be analyzed.
The set holds up to 5 accounts in total, with your own account optional. A larger list means a second report rather than a wider table.
What is a good engagement rate on X?
A good engagement rate on X depends on which rate you mean, because two different calculations share the name. Always write the basis beside the figure.
The per-follower rate and its platform average
Circleboom's free Twitter X Metrics Calculator reads a public account's last 100 posts and calculates interactions per follower. It states the platform average as 0.02%, and it labels the bands this way:
- Up to 0.003%: low.
- 0.003% to 0.02%: good.
- 0.02% to 0.07%: great.
- 0.07% or higher: excellent.
Those bands are the only platform-wide figures I would quote here, and they apply to this calculation alone. To check a single post rather than an account, the Twitter tweet engagement rate calculator covers that narrower job.
The per-impression rate in a peer report
The competitor report uses a different formula: total engagement divided by total impressions. It describes how often people shown a post interacted with it, so it says nothing about audience size.
Treat these as two separate instruments, and never place one rate next to the other as if they measured the same thing.
That confusion is how a defensible benchmark falls apart.
The report publishes no sector norm, by design. Your peers' rates on this basis, for the same date, are the norm you compare against.
Read any outlier before you quote it. Inspect the inputs and the posts behind an unusual rate, since a rate can be correct and still rest on very few impressions.
Was our drop the market or just us?
A drop that shows up across your whole peer set points to the market, and a drop on one account points to that account.
Own-account analytics cannot separate the two, because the peer line is missing.
The report's cadence panel prints Lifetime Average beside Last 30 Days Average for each account.
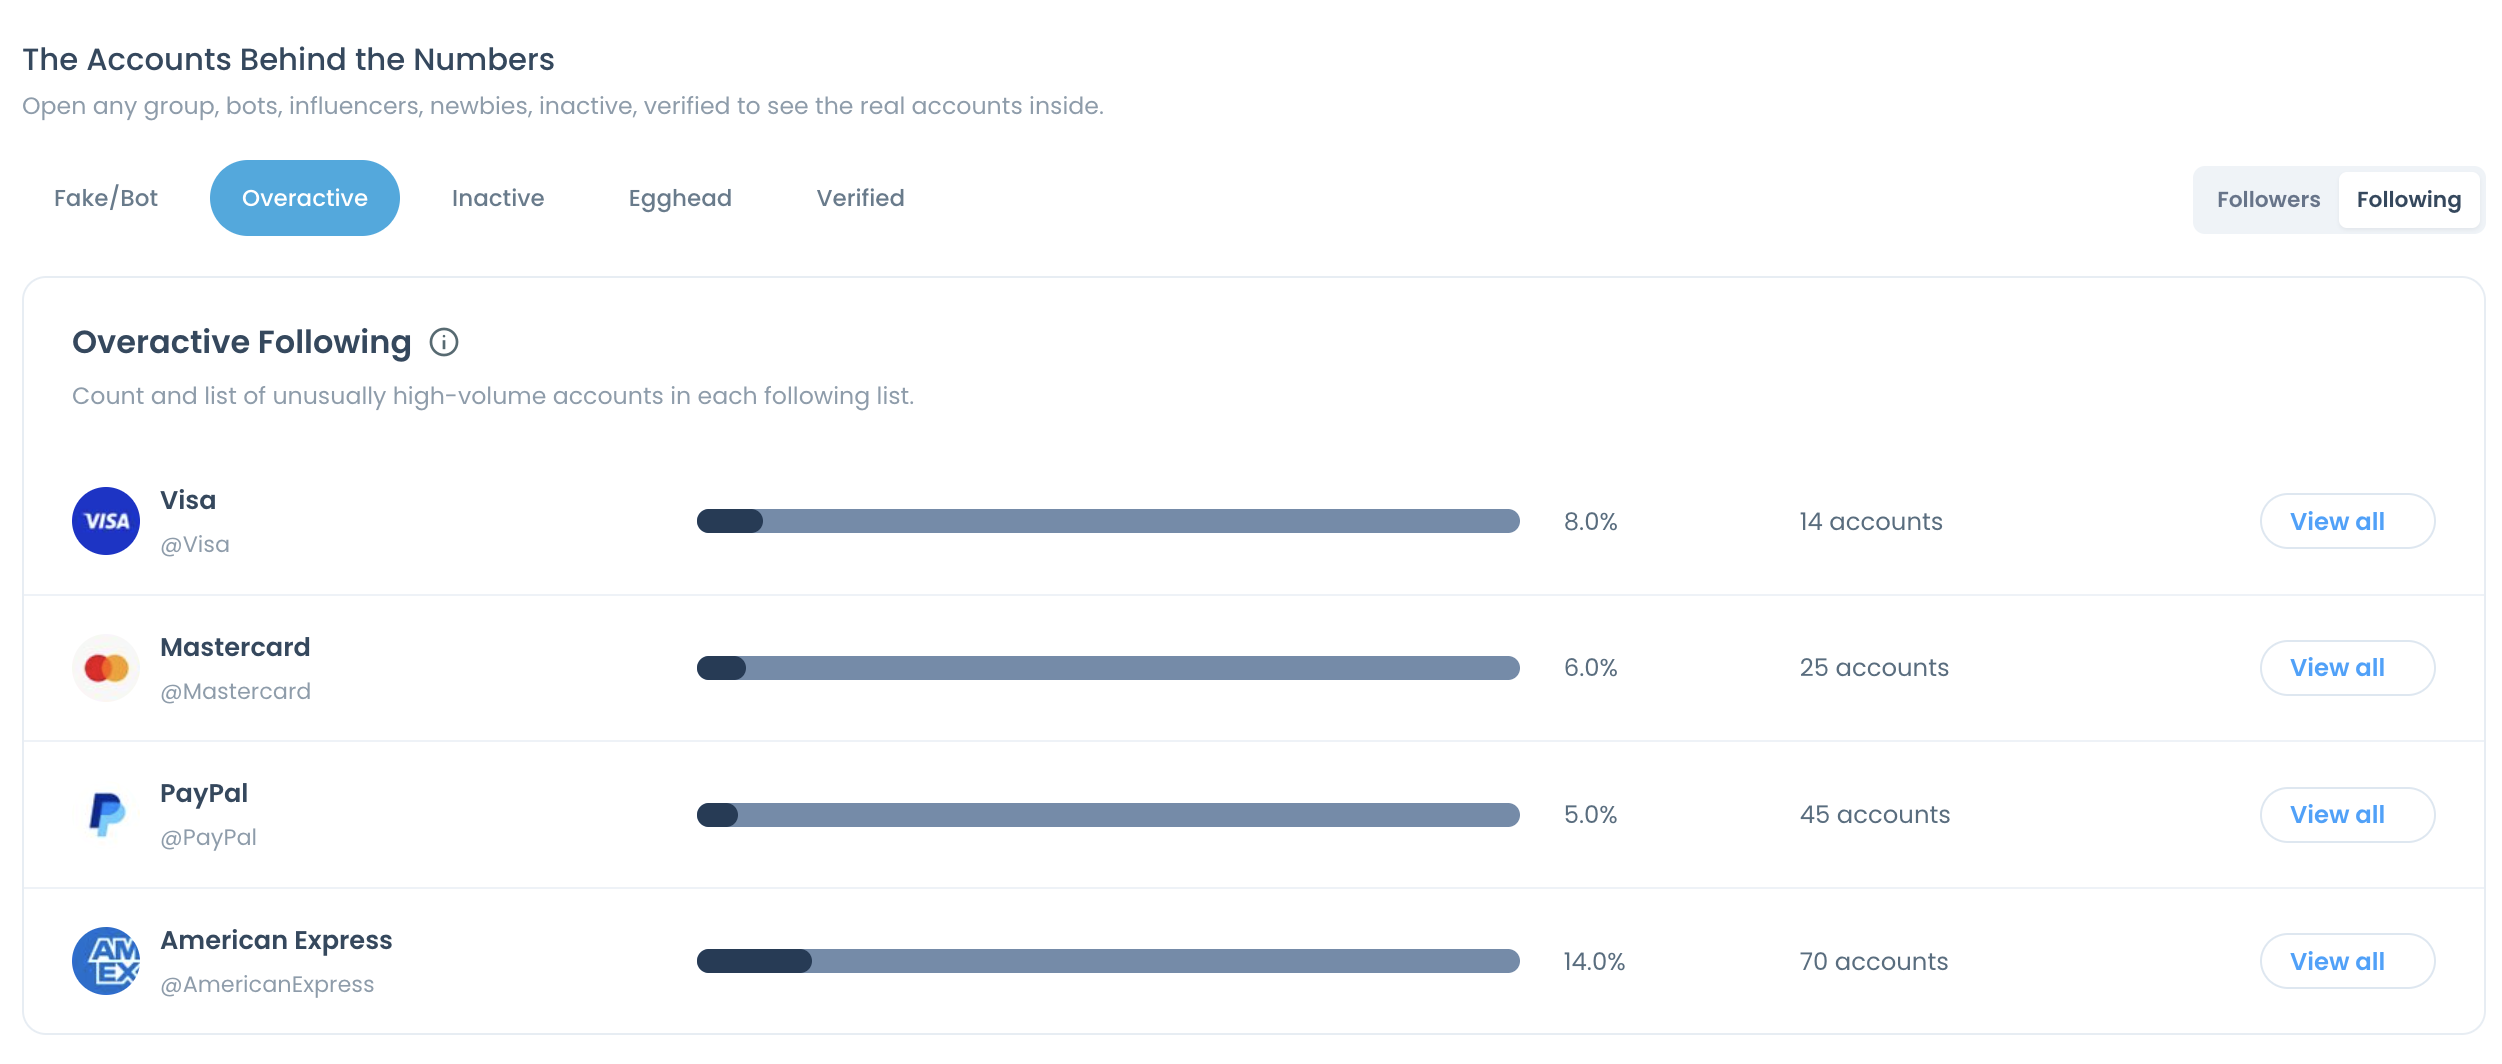
In our sample report on public accounts, comparing Visa, Mastercard, PayPal and American Express, accounts with lifetime averages above 11 posts per day were publishing a fraction of that in the last 30 days.
Across the set, that reads as a category shift rather than one team's decline.
Treat these figures as a demonstration of the pattern, never as current facts about those companies.
A peer run can also test wider claims on your own category, such as whether Twitter has reduced organic reach for small to mid accounts.
Before you call it, check two inputs:
- Whether the change sits in per-post averages or only in monthly totals, since totals move with post count.
- Whether the sample moved, since each re-run refreshes a rolling window of up to about 3,200 recent posts per account.
How to build Twitter industry benchmarks you can defend
To build a defensible benchmark, pull your chosen peers in a single dated run, then record the low and high of each metric with its basis beside it.
The workflow below takes four steps inside Circleboom, and it needs no access to the other accounts, since every slot can hold any public X account.
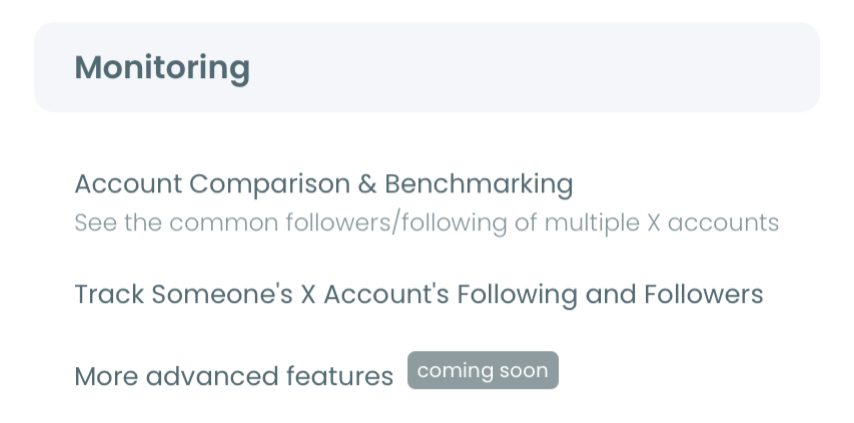
Log in and open the Monitoring menu
- Log in to Circleboom and connect your X account.

- Navigate to the Monitoring menu and select X Competitor Benchmark Report.
Enter the peers and start the run
- Add up to 5 handles under Account Handles, select Start Competitor Analysis, then pick Just this once or Keep it up to date every month. Competitor Tokens are charged per competitor per report, and your own account never uses one.
Record each range with its basis
- Copy the low and high for each metric you plan to use, with the run date, account set and sample basis beside them. The Followers and Following toggle changes the audience block only, so note which view each audience figure came from.
This sequence works because the set is decided before any number exists, so nobody can pick peers to flatter a result. The date and basis travel with each figure, which is what lets it survive a review.
At a glance: pick peers, run once, write ranges, keep the basis.
Unlike a hand-built sheet, where each figure was gathered differently, this method pulls the same fields for every account on one date.
Circleboom is an official X Enterprise Developer, which gives you a source to name when asked.
You can define Twitter industry benchmarks from official records with that answer ready.
How to turn industry ranges into a realistic target
A realistic target sits inside your direct peers' range and matches the output your team can sustain. Reading the top of the range as the goal is the usual error, since the top may belong to an account with a production team behind it.
Work through it in this order:
- Split the gap. Compare monthly totals with per-post averages to learn whether the gap is volume or effectiveness.
- Price it. A rival ahead on totals and level on per-post averages is ahead on output, and a per-post gap costs less to test than a new hire.
- Pick one. Choose the largest gap you can act on, such as audience quality, timing, format, reach or video usage.
Here is an illustrative calculation from the report's own logic. Two accounts each earn 1,000 engagements, one from 20,000 impressions (5%) and one from 100,000 (1%).
The target for the second account is a better rate on the posts it already publishes, not more of them.
Keep the claim at the right strength. These comparisons show observed relationships, and a benchmark never proves that one tactic caused a result or forecasts what a campaign will do.
If the question behind your target is geographic, the Twitter follower demographics view is where to start reading whether an audience already exists in that market.
Action checklist for your first benchmark
A defensible benchmark needs a short list of decisions, each one written down:
- Choose direct peers on market, language, scale, purpose and business model.
- Keep category leaders in a separate study list.
- Run all accounts together, on one date.
- Write the basis beside every rate you quote.
- Save the run and keep the set frozen for the next one.
Those five habits are what separate a benchmark from an interesting number.
→ Run Twitter industry benchmarks on your own peer set
FAQ: engagement rates and benchmark basis on X
Which metrics are not worth competing on in my industry?
Skip any metric that comes back flat across your whole set, since it offers no room to differentiate. In our sample report, verified followers ran 2.1% to 2.7% and active followers 36% to 38%, while suspected bot share spread from 20% to 34%.
How often should I re-run the benchmark during a year?
Monthly is the simplest pattern: Keep it up to date every month produces today's report plus one per month, so a 12-month schedule is 13 reports. Earlier runs stay under Past Analyses, which is what turns two dated runs into a direction and a year of them into a series.
Can published Twitter stats replace my own benchmark?
Published figures work as background, such as these Twitter stats that are useful for framing a channel. They cannot replace a peer run, because they do not describe your accounts, your date or your basis.
Can I quote these numbers in a report or study?
Yes, as long as the run date, account set and sample basis stay beside each figure. Say which are retrieved fields and which are Circleboom calculations, since classifications and demographics are Circleboom analysis of official X records rather than verdicts issued by X.