
A rival's impressions look like they leap one week and sink the next.
The cause is usually the chart you are reading: a monthly total moves with how much they post, while an average per tweet moves with how well each post travels, and only the pair tells you which one changed.
Manual: opening a rival's tweets one at a time and copying view counts into a sheet, with a different date on every row. Circleboom: one dated run where Circleboom plots monthly impressions and weekly averages per tweet for up to five X accounts side by side, built from records it pulls through X's Enterprise API.
→ Track competitor impressions on X week by week
Below: the four ways those two charts move, and what each one tells you.
Why a competitor's impressions on X seem to jump around
A competitor's impressions change over time for two separate reasons: they publish more or fewer tweets, or each tweet is shown to more or fewer people. A monthly total mixes both reasons into one bar, so a tall bar on its own cannot tell you which one happened.
That is the symptom most people describe. They see a rival's numbers climb, assume the rival found a better content formula, and start copying it.
Often the rival simply posted more.
The second trap is the single tweet. One post that travels far can lift a whole month, and if you only check a rival's profile you will notice that post and miss the twenty quiet ones around it.
X ranks and distributes each tweet on its own signals. The mechanics of how tweets are ranked by the Twitter algorithm explain why one post can outrun an account's normal level.
Checking view counts tweet by tweet does not fix either problem. You collect numbers on different days, over periods that do not match, with no shared method across accounts.
To track competitor impressions on X in a way you can defend, you need the same two figures for every rival, pulled on the same date: the monthly total and the average per tweet. You can track competitor impressions on X in one report instead of keeping that sheet by hand.
What the X competitor report charts about impressions
Circleboom's X Competitor Analysis & Benchmark Report has a section labeled Impression/Views. Its own subtitle calls impressions "the truest visibility metric on X," and it holds the charts you need to track competitor impressions on X over time:
- Total impressions overtime: the sum of each tweet's impressions per month, for every account in the set, with a Total and Average toggle that turns the same months into Average impressions per tweet overtime.
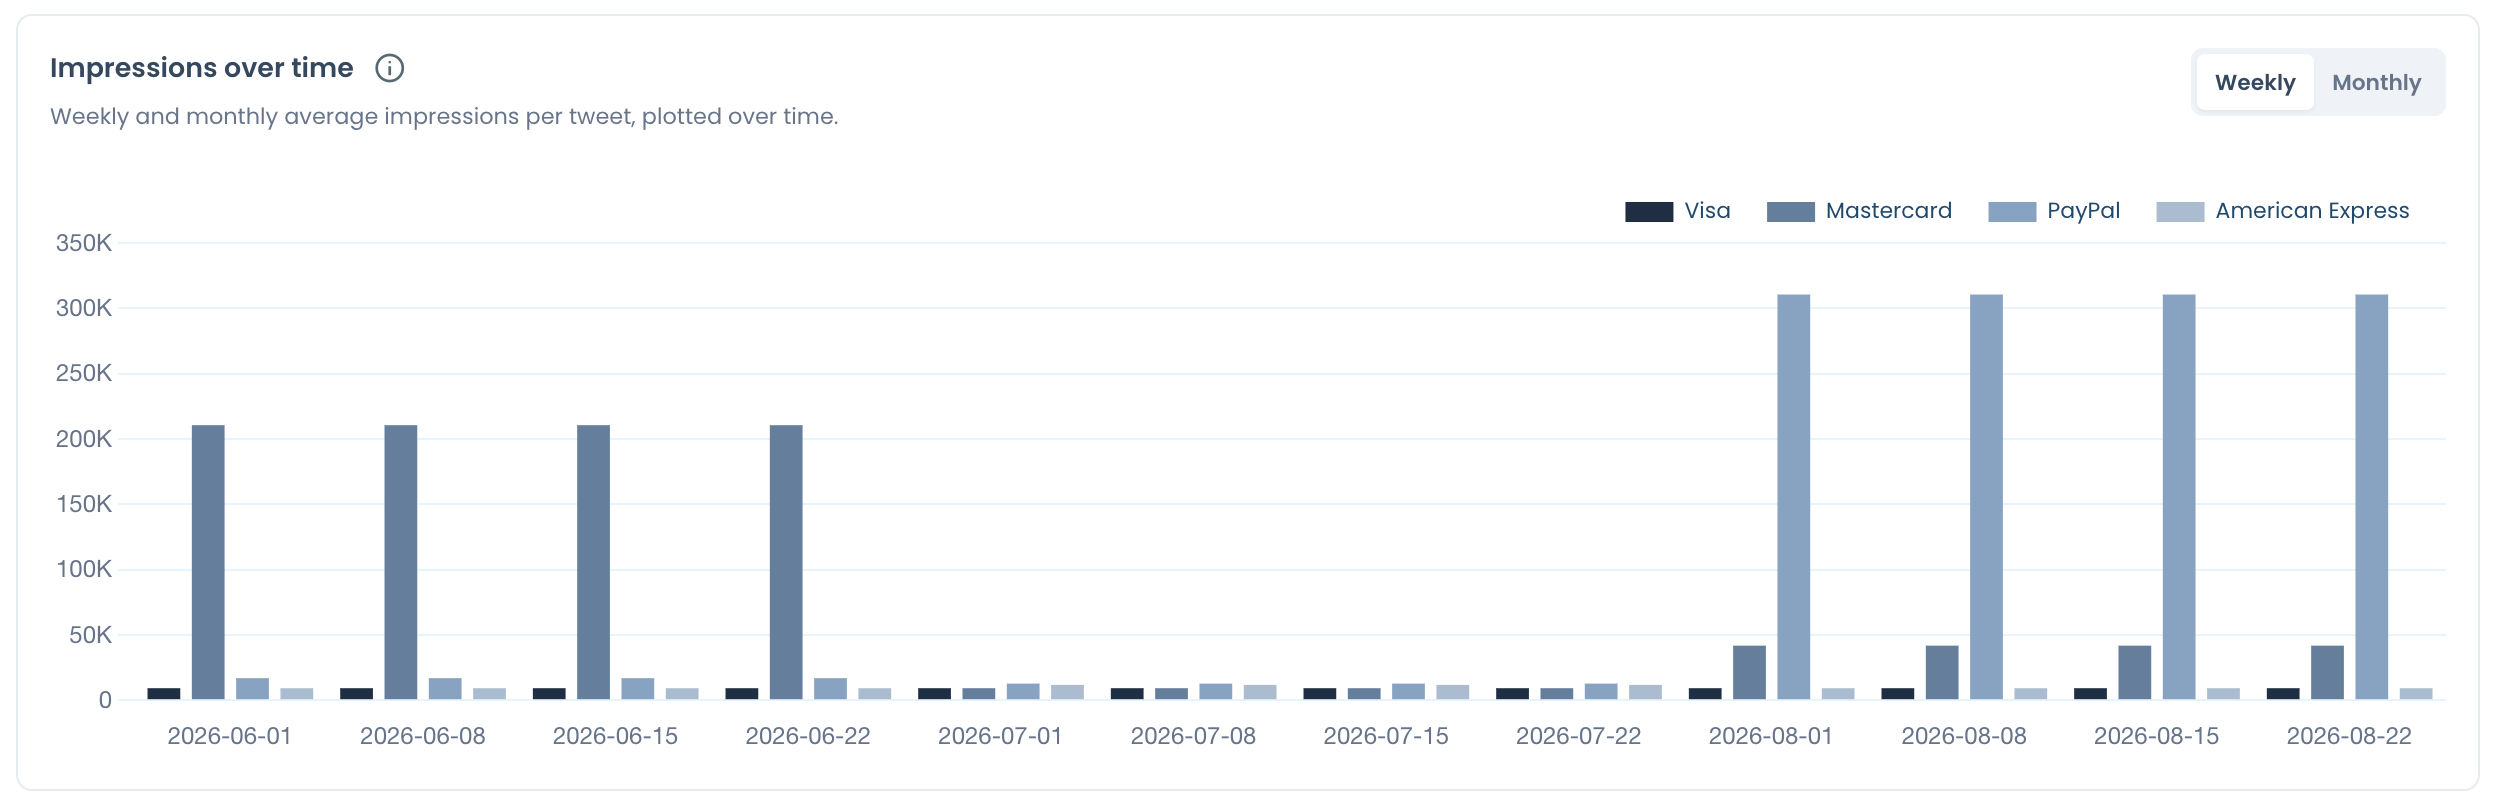
- Impressions over time: average impressions per tweet with a Weekly and a Monthly toggle.
A third figure sits at the top of the report. The essentials table carries an AVERAGE IMPRESSIONS column for each account, which is an average across the analyzed tweets, not a period total.
One exceptional post can lift that column, so the report pairs it with the charts.
Circleboom compares up to five X accounts in one run, your own plus four rivals or five accounts of your choice. It reads up to about 3,200 recent tweets for each, from public accounts under 3,000,000 followers.
Where the impression data comes from
The records behind every bar come from X itself. X publishes the companies it gives Enterprise API access, and Circleboom is on that roster, so the impression records arrive through access X granted.
That matters for impressions in particular, because a monthly total is only as complete as the list of tweets behind it.
If you want to see the layout first, the X competitor sample report shows every section, run on public accounts. When you are ready, measure competitor impressions on X across five accounts and read the charts together.
What are the four ways a competitor's impressions change on X?
A competitor's impressions change in one of four patterns, and you can only name the pattern by reading the monthly total and the average per tweet side by side. Each combination points at a different cause:
| Monthly total | Average per tweet | What changed |
|---|---|---|
| Up | Flat | More tweets, not better ones |
| Up | Up, and holds | Each tweet reaches more people |
| Up for one month | Up that month only | One post traveled |
| Down | Down | Visibility per post fell |
The first row is the easiest one to misread. A rival who doubles their output can double their monthly total with no change in how each tweet performs.
A flat average with a rising total means more output, not better posts.
The second row is the one worth studying. When both lines climb, something about their tweets, timing or audience is earning wider distribution, and their recent posts deserve a close look.
The third row needs the leaderboards. When both lines jump for a single month and fall back the next, one standout tweet usually sits behind it, which is an outlier rather than a strategy.
The fourth row is a true decline. Before you read it as their problem, check whether your own account and the other rivals dropped in the same month, a test covered further down. Accounts caught in a broad dip often ask whether Twitter reduced organic reach for small to mid accounts.
A simple example shows the arithmetic. A rival posting 60 tweets a month at 3,000 impressions each collects 180,000 impressions. If they move to 120 tweets at the same 3,000 each, the monthly total doubles to 360,000 while the average per tweet does not move at all.
How to tell a one-week spike from a real shift on X
A spike is one tall week surrounded by normal weeks. A shift is a new level that holds week after week.
The weekly view of the Impressions over time chart separates the two, because it shows average impressions per tweet for each week instead of folding a month into one bar.
In a sample report run on public accounts, the weekly view tells two different stories. One account sat far above the others for every week of June, then dropped back to the pack in July. Another stayed low through July, then held a much higher weekly average through each week of August.
Neither is a one-week spike. Both are steps: a level that arrived, held and then changed.
When you track competitor impressions on X week by week, that distinction decides what you do next. A spike sends you to find one tweet. A step sends you to find what changed in how they publish, such as cadence, format or timing, during the week the new level began.
Read the weekly view first, then the monthly view, and only then draw a conclusion.
One practical rule helps here. Treat any change that lasts a single week as a question, and treat a change that holds across several weeks and shows up again in the next dated run as a pattern worth reporting.
How to track competitor impressions on X with Circleboom
To track competitor impressions on X, put your rivals in one benchmark report, read the monthly total and the weekly average per tweet together, and keep the same set on a monthly schedule. Circleboom handles the pull and the layout from its Monitoring menu in five steps, grouped into setup and reading.
Set up the rival set in the Monitoring menu
- Log in to Circleboom Twitter and decide whether your own X account takes the first slot.

- Open the Monitoring menu and select X Competitor Analysis & Benchmark Report, the first item in the list.
- Add up to five handles under Account Handles, select Start Competitor Analysis and choose Keep it up to date every month, so each month adds a fresh dated report for the same accounts.
Read the Impression/Views charts
- Scroll to Impression/Views and set Impressions over time to Weekly to see each account's average impressions per tweet week by week.
- Switch the monthly chart between Total and Average for the same months, and note which of the four patterns each rival shows.
Setup comes first because every account is then pulled on the same date with the same method, so the bars share one basis. Reading the weekly view before the monthly total stops one tall month from passing as a trend.
Is my drop in X impressions mine or the whole category's?
If your impressions fell and every rival in your set fell in the same months, the drop is a category or platform shift, not something your account did. If only your line fell while the rivals held, the cause sits in your own publishing.
That single comparison is the main reason to track competitor impressions on X alongside your own numbers.
Own-account analytics cannot make this call. They show your line with nothing beside it, so a niche-wide dip looks like a personal failure.
The report puts your account in the first slot and four peers next to it, all pulled on one date.
When the drop is yours alone, the usual suspects are timing, cadence and audience quality. The checklist in why your Twitter impressions suddenly drop walks through them one by one.
What changes when your impressions drop: a shadowban check, your best posting hours and Auto Retweet, step by step.
When the whole set drops together, the right response is often to hold your plan rather than cut output. A five-account comparison tells you whether the dip is niche-wide for your own corner of X instead of leaving you to guess.
Why a competitor's numbers change between two dated reports
A rival's impressions can change between two reports even when nothing about their strategy changed. Each run reads the most recent tweets for every account, so between runs new tweets enter the sample, older tweets leave it, and tweets already in the sample can collect more impressions.
Anyone who tracks competitor impressions on X across several months needs that in mind.
The rolling window has one more effect. Up to about 3,200 recent tweets can cover a few months for an account that posts many times a day and many years for an account that posts a few times a week.
So check the dates the tweets cover before you compare two accounts.
Circleboom never overwrites an earlier run, and each saved set keeps its older reports under Past Analyses. The help page on how to refresh a competitor report or see past reports shows where each dated version sits.
Compare the same section in two runs in this order: averages per tweet, then monthly totals. Confirm a change in more than one chart before you call it a cause.
Finding the tweet behind a rival's impression spike
When one month towers over the rest, the Content Leaderboards section shows you the tweet behind it. The Top 5 Tweets by Impressions panel lists each account's five most-seen tweets, and the top tweet head-to-head panel puts each account's single best tweet side by side.
This is where the habit to track competitor impressions on X turns into a content lesson. Open the spike month, then check its top tweets. If one post dominates, you have found an outlier: note its topic, format and timing, and move on.
If several of the top five sit in the same month, the rival changed something that month.
The leaderboards also show that impression leaders and engagement leaders are often different tweets. A post can travel far and collect little response, so read the Top 5 by impressions and the Top 5 by engagement together before you copy anything.
If the lesson is about timing, act on it with your own audience's hours. Circleboom's best time to post on Twitter shows when your followers are online.
The one rule for reading rival impressions on X
Every chart in this article comes back to one habit: track competitor impressions on X as a total and an average together, on dated runs, for the same accounts, before you decide anything. Whoever keeps that habit stops copying rivals who only posted more.
→ Start tracking competitor impressions on X this month
Competitor impressions on X: FAQ
Can anyone see how many impressions a competitor's tweet gets?
Yes. X lists impressions as a public metric in its developer documentation on metrics, visible to anyone, while engagements and profile clicks stay private to the account owner. X's API documentation also describes an impression as "a count of how many times the Post has been viewed," which is why the competitor report can chart a rival's impressions but never their profile clicks.
How do I put my own impressions next to a rival's?
Add your account to the first slot of the competitor report, then open Circleboom's Twitter impression analytics for your own tweets. For your account totals on X itself, see how to see your total impressions on Twitter.
What does a year of monthly competitor reports cost in tokens?
To track competitor impressions on X for a full year, plan on Competitor Tokens, which are charged per competitor per report; your own account never uses one. A 12-month schedule is 13 reports, the first plus one a month, so five competitors on that schedule cost 65 tokens.