

Impressions on X count how many times a post appeared on a screen, and X shows you only a rolling 28-day summary unless you pay for Premium. There is a fuller way to read that number.
Can you check impressions on X (Twitter) without X Premium?
Yes. Circleboom pulls every post's impression count on X through official API access, charts it as a trend from 7 days to a full year, and ranks your entire tweet history by reach, so one dashboard answers what X's 28-day summary cannot.
→ check impressions on X (Twitter)
An impression fires every time your post lands on a screen. It is not unique. The same person scrolling past twice counts as two, and X's own reference for how it counts each metric confirms an impression is simply a count of times a post was seen. That single fact is why the number is easy to check and easy to misread.
Why the impression number alone can mislead you
Most guides stop at "tap the bar icon under a tweet." That shows the raw count, but the count carries no verdict. A post can gather 40,000 impressions from autoplay scroll-past and still earn almost no clicks or replies. Reach is exposure, not approval.
If you would rather read reach as a trend than a lone number, you can see your X impression trend in one dashboard instead of tapping through posts one at a time.
The useful question is not how many impressions you got. It is whether that reach turned into anything. Answering it needs two views: the trend of impressions over time, and the impressions of each individual post set next to its engagement. A single number in isolation cannot tell you which of your posts are actually pulling their weight.
Native X gives you neither the multi-month trend nor a way to rank your full history. You see one post at a time through the bar icon, a rolling 28-day total that erases everything older, and a fuller dashboard locked behind Premium. That is why so many people end up learning to check Twitter analytics without Premium through a connected account instead of fighting the native limits.
How to check impressions on X (Twitter) without Premium
To check impressions on X the accurate way, read them on two layers: first the account-level trend, then the per-post ranking. The trend tells you which direction reach is moving; the ranking tells you which posts drove it and whether that reach converted. Circleboom runs both from one connected account.
Connect your X account and open Post Analytics
- Log in to Circleboom Twitter and connect your X account through official OAuth.

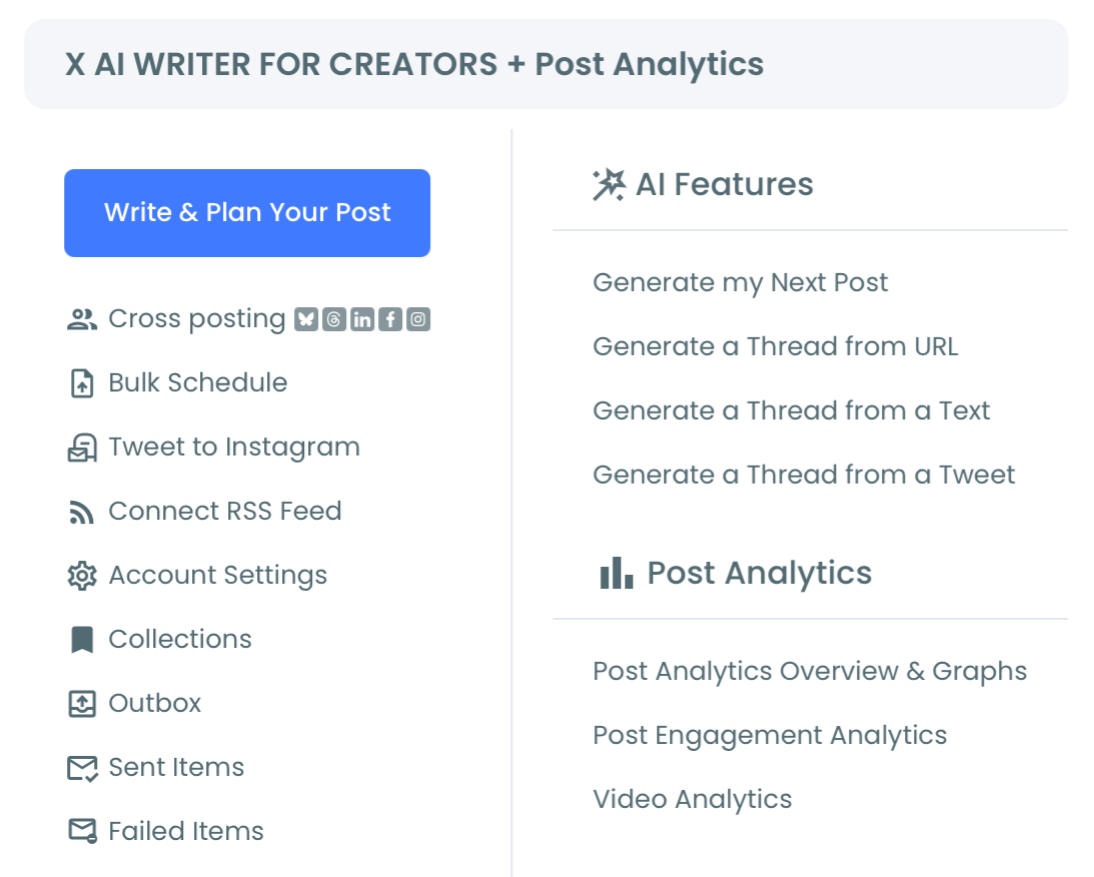
- Open the X Post Planner menu and go to the Post Analytics area.
Read the impression trend, then rank every post
- Select Impressions in one of the Insights dropdowns inside Post Analytics Overview & Graphs, then pick a time range: 7D, 2W, 4W, 3M, 1Y, or a custom window from the calendar.
- Read the impressions summary card, which shows the total for the period plus a percentage change against the previous equal-length window, marked with a green up arrow, red down arrow, or gray no-change symbol.
- Switch to Post Engagement Analytics and sort the table by the impressions column to rank every accessible post from widest reach to narrowest, then read each post's engagement rate in the same row.
That order works because the Overview answers the macro question, whether reach is rising or falling, before the per-post table answers the tactical one, which posts carried it and whether that exposure converted. Reading the ranking without the trend, or the trend without the ranking, leaves half the picture missing.
At a glance: connect, chart the impression trend, then sort your history by impressions and check engagement rate beside it.
Quick demo: how the same tweet reads once impressions and engagements sit in one view.
Because Circleboom is an official X Enterprise Developer company with authorized data access, the impression counts you read are the full figures X returns, not partial numbers scraped from a public page. That accuracy matters most when you are about to make a content decision from the data. You can start to see your total X impressions the moment your account connects.
Impressions, engagements, and engagement rate
These three metrics answer different questions, and treating them as one is the most common analytics mistake:
- Impressions measure how many times a post was displayed, including passive scroll-past.
- Engagements measure active responses: likes, reposts, replies, bookmarks, and clicks.
- Engagement rate divides engagements by impressions, so it shows how well reach converted.
A post with huge impressions and a low engagement rate reached people who kept scrolling. A post with modest impressions and a high engagement rate found the right people. This is also why the question of whether likes count as impressions comes up so often: the two live in different columns, and mixing them hides what actually happened.
Circleboom's Post Engagement Analytics ranks each post by any signal, so the second layer takes seconds to read. One caution from the tool itself: on a 7-day range, a single viral post can inflate the percentage change against a quiet prior week. Longer ranges like 4W and 3M give steadier trend signals, so read short-range swings with care.
A worked example of the two-layer read
Picture two posts from the same month. The first pulled 50,000 impressions and 300 engagements, an engagement rate near 0.6 percent. The second pulled 8,000 impressions and 640 engagements, a rate of 8 percent. On the bar icon alone, the first looks like the winner by a mile.
The two-layer read flips that verdict. The first post reached a huge, indifferent scroll; the second reached a smaller audience that actually responded. If you were choosing which format to repeat, the 8,000-impression post is the real signal. That comparison only appears when you rank posts by impressions and read engagement rate beside each one, which is exactly what the Twitter content performance analysis view is built to show.
What actually counts as an impression
Not every view is obvious, so it helps to know what X folds into the number. An impression is logged when your post shows up in a home timeline, in search results, on a profile, inside a notification, or as a quoted or embedded post elsewhere. Autoplay counts. A repeat view by the same account counts again. What the figure never tells you is who those viewers were or whether a single one paused, which is precisely why the second layer, engagement, exists.
This is why questions like whether quote tweets generate impressions come up so often, since a quoted post is counted wherever it surfaces.
That breadth is also why impressions almost always dwarf your follower count on a post that traveled. A tweet seen 20,000 times was not seen by 20,000 people; it was displayed 20,000 times, replays included. Reading the count with that in mind keeps you from mistaking distribution for demand, and it explains why two posts with identical impression totals can have wildly different value.
Comparing two periods to test a change
The trend view earns its keep when you change something and want proof it worked. Say you shifted your posting cadence or leaned into a new topic. Select the weeks before the change as one window and the weeks after as another, then read the impression line and the summary card's movement across both.
The summary card always compares your selected period against the immediately preceding window of equal length, so a 4W view measures the last four weeks against the four before them. There is no manual control over that comparison window; it is always the preceding period of the same size.
That built-in before-and-after read is the most direct way to tell whether a decision moved reach or only felt like it did. Keep the ranges equal and longer than a week, since a 7-day comparison can swing on a single strong post.
What the two-layer read changes about your posting
Once you can rank your whole history by impressions, patterns appear that a 28-day summary hides. If your five highest-impression posts share a format, that format is your reach engine. If your highest-engagement-rate posts are a different set entirely, you have found the gap between what gets seen and what actually lands.
For the wider metric map behind those numbers, it helps to keep a complete guide to Twitter analytics metrics within reach.
That is the practical payoff of checking impressions properly. You stop guessing from a rolling summary and start reading reach as a trend you can act on. And when you want a second reference on pulling the raw total, here is how creators see their total impressions on Twitter in one place.
More than one number moves at once
Impressions never travel alone. Alongside them, the Overview tracks likes, reposts, replies, bookmarks, profile clicks, URL clicks, and video views, each shown as its own summary card with a total and a period-over-period change. That matters because impressions and clicks often move in opposite directions. A post can lose reach while its link clicks climb, which tells you a smaller, more intent-driven audience found it.
Reading impressions next to profile clicks and URL clicks is where reach turns into a business signal. Impressions say you were seen. Profile clicks say someone wanted to know who you were. URL clicks say someone acted. The trend of those three together tells a fuller story than any single metric alone, and it is the reason a serious review never stops at the impression card.
When to check your impressions
Impressions are worth reading at specific moments, not obsessively. Open the trend at the start of any content review, before you judge individual posts, so a strong post is read against the right baseline. Pull it again after a campaign to see which posts actually carried the reach. And check it monthly or quarterly when you need to show trajectory to a client or a team, where a chart of impressions over time communicates progress far better than a single tweet's metrics ever could.
What checking impressions really tells you
Checking impressions on X is not about finding a bigger number. It is about reading reach as a trend and setting it next to engagement so you know whether the reach worked. Native X gives you a per-post count and a 28-day window; the two-layer method gives you the whole story without Premium.
Common questions about X impressions
Do impressions on X mean unique viewers?
No. An impression is counted every time your post appears on a screen, so the same person seeing it twice counts as two impressions. Impressions measure exposure, not the number of distinct people, which is why they read higher than reach.
Can I see impressions for older tweets, not just the last 28 days?
Yes. Circleboom charts impressions across ranges up to a full year and ranks your accessible tweet history, well beyond X's rolling 28-day summary. The one limit is X's own retention: very old posts may return partial or zero analytics because X no longer serves that historical data through its API.
Are impressions the same as engagements?
No. Impressions count how often a post was displayed; engagements count active responses like likes, replies, reposts, and clicks. The ratio between them, engagement rate, is the metric that tells you whether your reach actually converted.
Does viewing my own tweet count as an impression?
In most cases an appearance on your own screen can register, which is one reason impression numbers can look slightly inflated on low-traffic posts. It is rarely enough to distort a trend, but on a post with only a few hundred impressions it is worth remembering before you read too much into a single figure.


%20without%20Premium)
