

Your Twitter peak engagement hours are the windows when your specific follower base is most active and most likely to interact with what you post. They are not the global "best time to tweet" averages every vendor blog cites; those numbers reflect aggregate behavior across millions of accounts and do not match your audience's time zones, work rhythm, or attention patterns.
Circleboom maps your followers' activity hour by hour and day by day through official X Enterprise APIs, so you can schedule against your real audience instead of the global mean.
Circleboom's When Followers Are Online feature analyzes each follower's recent engagement history and produces an hour-by-hour heatmap of when your specific audience is active. Posting against that map (instead of the generic "9 AM Wednesday" advice) typically lifts engagement rate measurably, especially for accounts with a non-US audience or non-standard time-zone composition.
→ find your Twitter peak engagement hours
The rest of this guide explains why global "best time" data misleads, what your account-specific heatmap actually shows, and the exact workflow.
Why Global Best-Time Data Misleads
Every social-media vendor publishes a "best time to tweet" study. The numbers cluster around weekday mornings, US business hours, with Wednesday or Tuesday as the strongest day. The studies are technically correct and practically misleading. They measure aggregate behavior, which means the average across millions of accounts collapses into a US-business-hour pattern that doesn't reflect any specific account.
Your account is not the average. If your followers cluster in Europe, your "9 AM Tuesday" is the wrong window; theirs is the right one. If your audience is mostly creators and freelancers, weekday business hours are when they are working, not scrolling; evening or weekend windows perform better. If your follower base is multilingual or spans Asia-Pacific, a single peak-time number is structurally wrong because you have two or three peaks, not one.
The best time to tweet and why is fundamentally an account-specific question. The fix is to look at your followers' actual activity hours rather than industry averages. Circleboom is listed in X's enterprise customer directory, so the per-follower activity data comes through authorized API access; the engagement signal that feeds the heatmap is read from the same source X itself uses, not scraped or inferred.
What the Heatmap Actually Shows
The When Followers Are Online view produces a 7-day by 24-hour grid. Each cell shows the percentage of your active follower base that is online and engaging during that hour-of-week. Darker cells are peaks, lighter cells are off-windows.
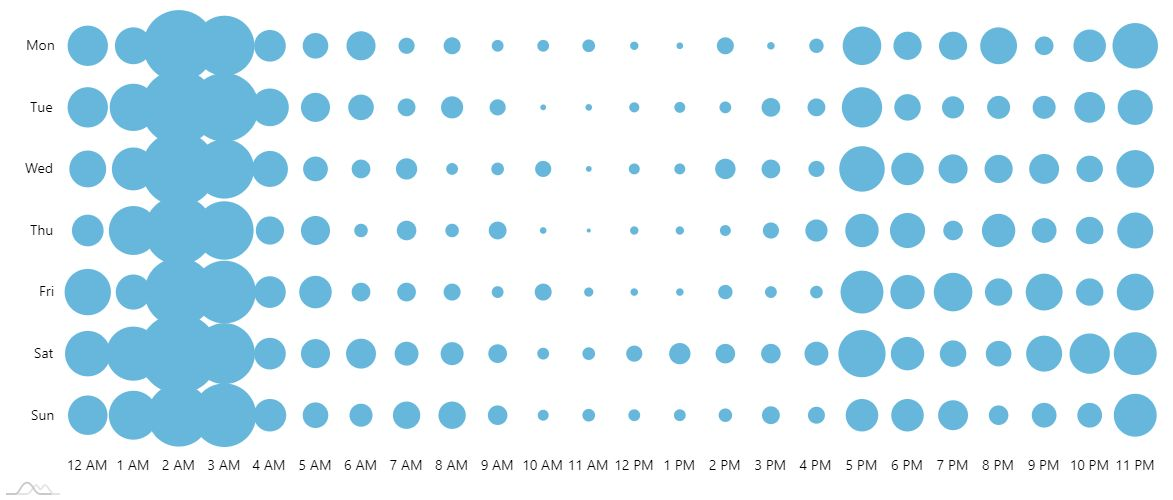
Three patterns emerge for most accounts. The primary peak (the single hour-of-week with the highest activity), usually a weekday window matching the follower-base time zone. The secondary peak (a second window with strong but not maximum activity), often a weekend or off-hours window where engaged followers scroll more leisurely. The dead windows (typically late-night and early-morning hours in your follower zone), where posting produces low first-sample engagement and triggers algorithmic throttling.
The single most actionable insight from the heatmap is usually that your primary peak is not what you assumed. Most accounts schedule against intuition (their own active hours) or against vendor averages; both diverge from the heatmap by one to three hours. Closing that gap is the lift. Anyone wondering how to determine your best time to post on Twitter has run into this divergence and resolved it differently; the heatmap resolves it empirically per account.
A second insight, often missed: the secondary peak is where most accounts under-post. Weekday business hours feel productive to post in, weekend mornings feel lazy. The data flips the intuition. The audience that is most engaged on weekend mornings is the audience that has chosen to keep scrolling X recreationally, which often produces higher engagement rates than the busy weekday primary peak.
Video walkthrough: how the When Followers Are Online heatmap surfaces account-specific posting windows that don't match global averages.
How Circleboom Maps Your Peak Engagement Hours
The full flow runs in about 5 minutes. There is no setup beyond connecting your X account.
Connect your X account to Circleboom
- Log in to Circleboom Twitter and authorize with official OAuth.

- Open the Follower & Following Management menu from the sidebar.
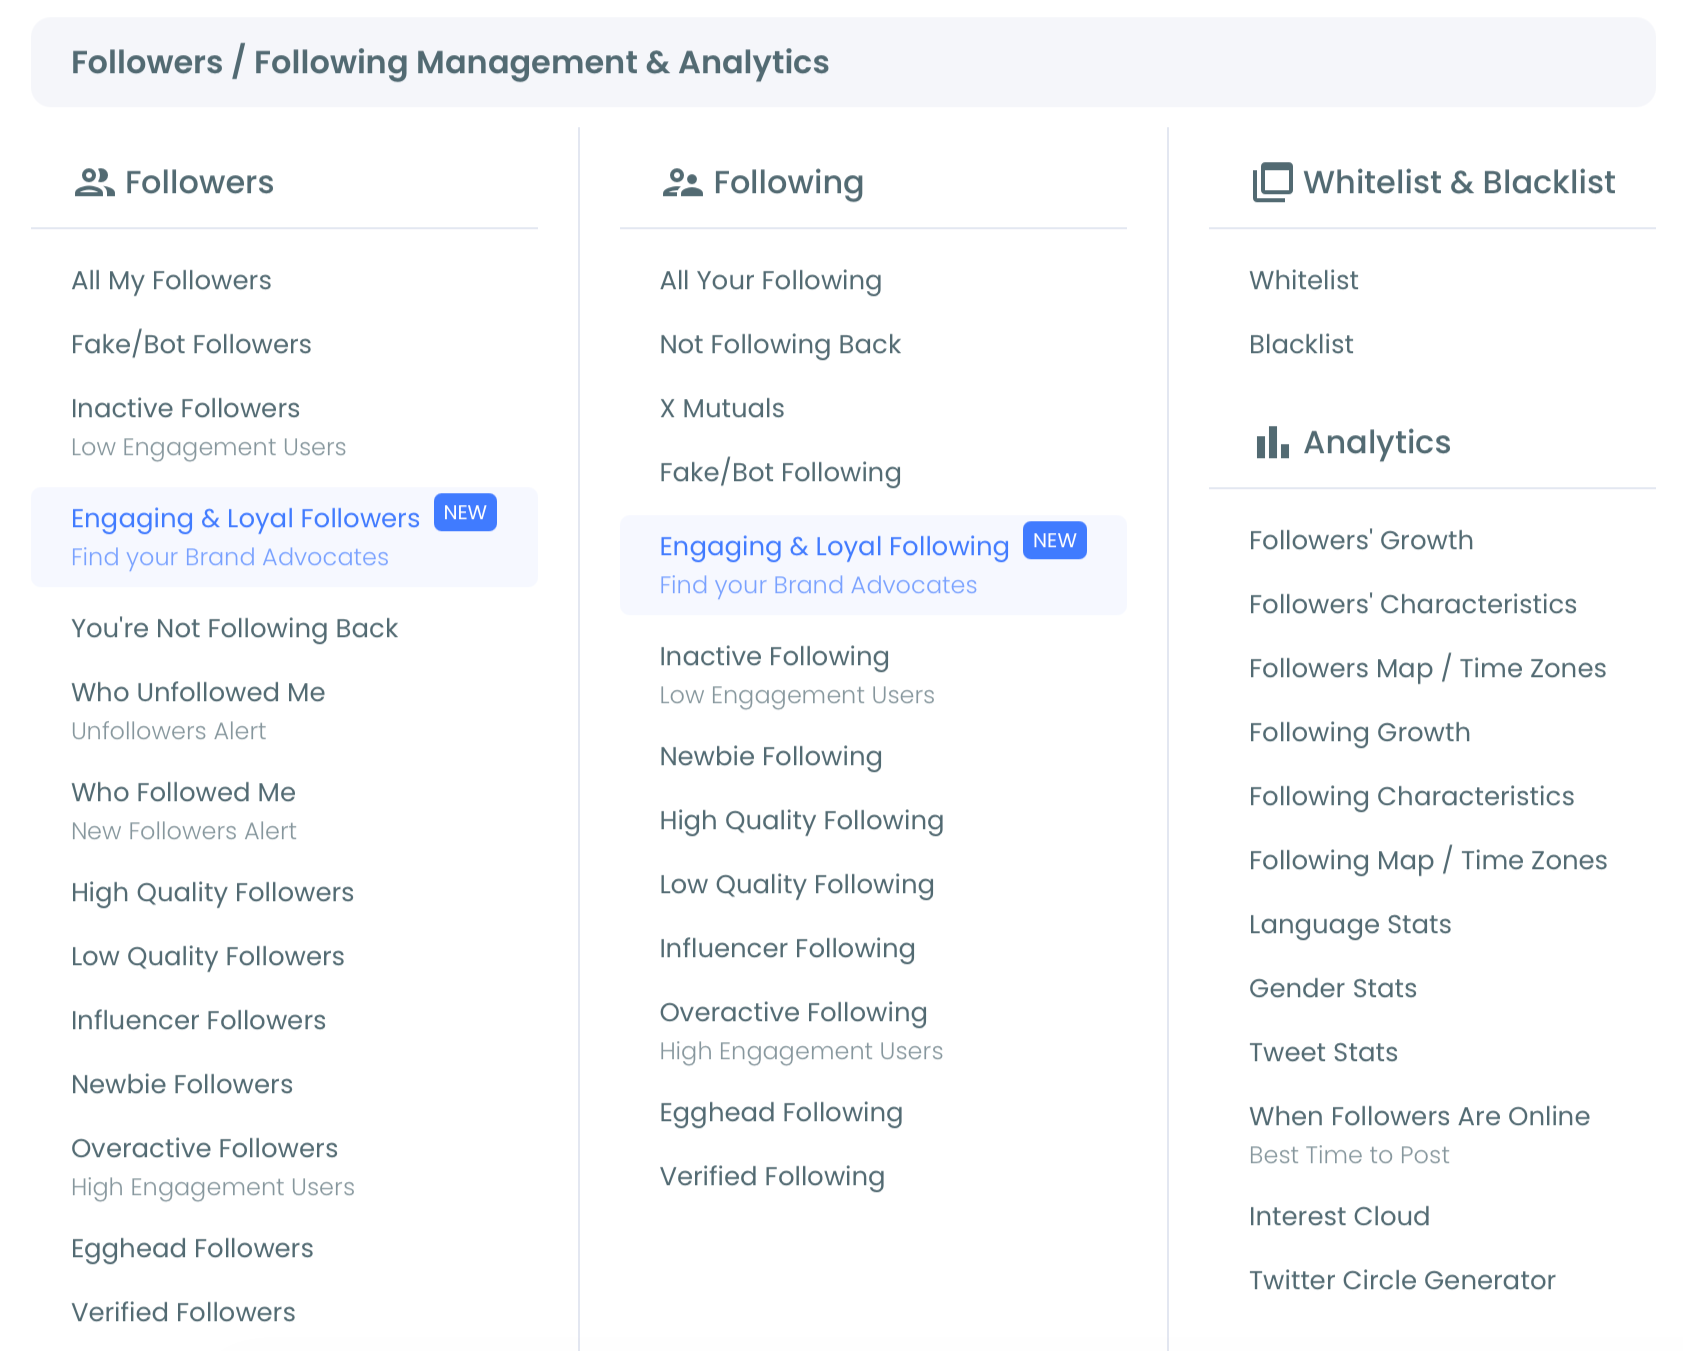
- Select When Followers Are Online under the Analytics section. The dashboard generates the 7-day by 24-hour heatmap for your specific follower base.
- Identify your primary and secondary peaks from the heatmap, then schedule your next content batch against those windows using the X Post Planner or a separate scheduler.
That sequence is what makes the workflow useful. Login earns official Enterprise API access first, the menu navigation gets you to the analytics surface, the heatmap reads your real audience activity, and the action layer (scheduling against the heatmap) converts the insight into outcome. You can pull your account's peak engagement hours in 5 minutes and rebuild your posting calendar around them in the next.
What Changes When You Schedule Against the Heatmap
Three changes typically show up within 30 days of switching from vendor-average scheduling to heatmap-based scheduling.
The first is straightforward: engagement rate rises measurably. Same content, same volume, posted into windows where the audience is actually active, produces a higher first-sample engagement signal, which the algorithm reads as resonance and distributes more widely. Most accounts see double-digit relative improvements in engagement rate within a month of switching.
The second change is in time-of-day analytics. Once you've been posting against your real peaks for a few weeks, your follower-side metrics start to clarify because the engagement is concentrated rather than diffuse. The Twitter user analytics dashboard makes audience composition legible because the engagement data underneath is no longer noise.
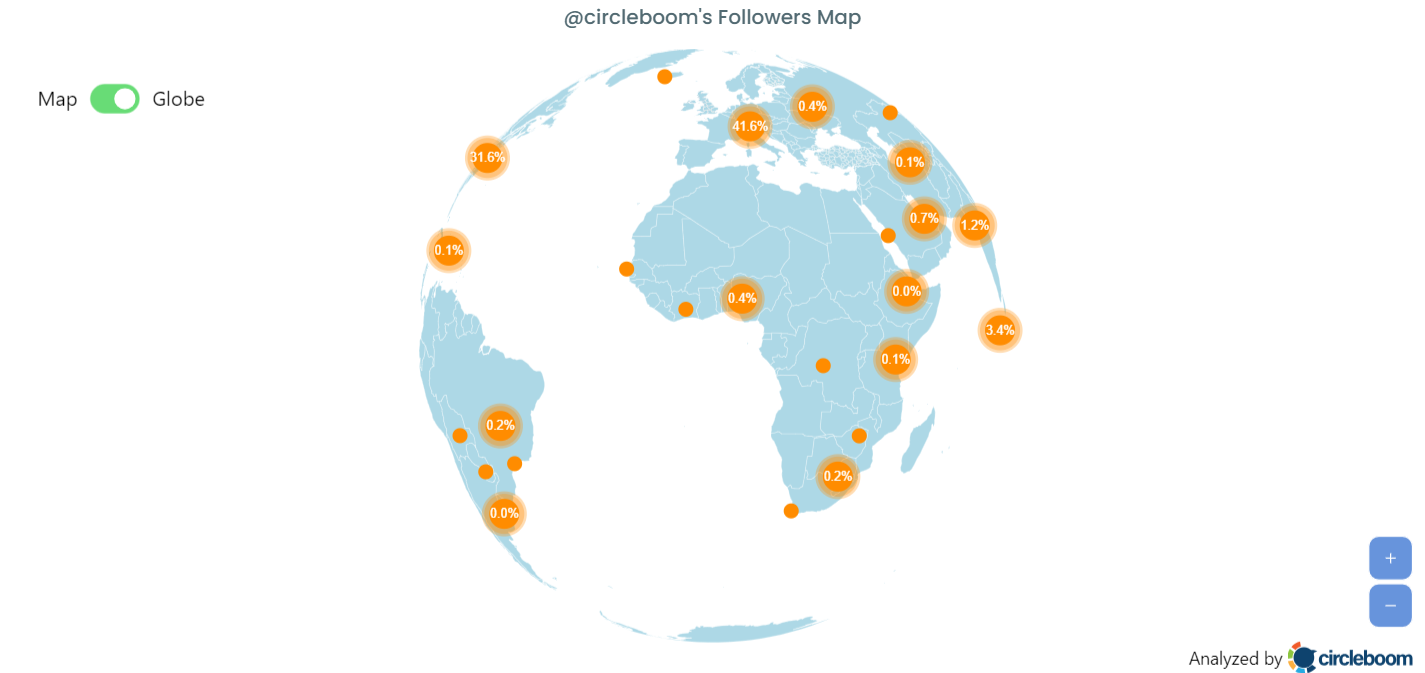
The third change is geographic. If your audience spans multiple time zones, you start posting twice (or three times) per day, hitting each major time-zone cluster's peak independently. Treating a multi-zone audience as a single audience is one of the most common scheduling mistakes; the heatmap surfaces the multi-zone structure visibly. The Twitter Followers & Friends Map complements this by showing where your followers live, so the heatmap's time-of-week pattern maps cleanly onto the geographic distribution.
A widely cited best-time-to-post research roundup frames the cross-platform context: most platforms benefit from account-specific timing, but X especially does, because the algorithm's first-sample-then-distribute mechanism is unusually sensitive to early-window engagement. Posting into a dead window on X is more punishing than on Instagram or Facebook because the cold start is steeper. Combined with insights on the most engaged time zones on Twitter, this is why the per-account heatmap is so high-leverage.
The Bottom Line
Your Twitter peak engagement hours are an account-specific signal, not a global one. Vendor averages collapse millions of accounts into a "9 AM Wednesday" answer that doesn't reflect your audience. The heatmap reads your real follower activity through official X Enterprise APIs and shows you the windows where your specific audience is actually online. Posting against the heatmap typically lifts engagement rate within the first 30 days because the first-sample engagement signal that drives algorithmic distribution starts landing against an active audience instead of a sleeping one.
Stop scheduling against the global mean. Pull your heatmap, identify your primary and secondary peaks, and rebuild your calendar around them.
→ Find your peak posting windows
Frequently Asked Questions
How is this different from X's "Best Time to Tweet" feature?
X's native Best Time to Tweet feature, where available, returns a single suggested window. Circleboom's When Followers Are Online produces a full 7-day by 24-hour heatmap, which lets you see your primary peak, secondary peak, and dead windows side by side. The heatmap also surfaces multi-time-zone audience structures that a single-window recommendation hides. The data source is the same underlying X API; the visualization and granularity differ.
How often should I re-run the heatmap?
Monthly is enough for most accounts. Audience composition shifts slowly, and once you've identified your peaks, they stay relatively stable for 30 to 60 days at a time. Re-running quarterly is also fine if your audience is not growing rapidly. Re-run sooner if you've had a major follower spike from a viral moment or campaign, because new followers can shift the heatmap meaningfully.
Does this work for accounts with audiences across multiple time zones?
Yes. The heatmap shows the multi-zone structure as multiple peaks rather than collapsing them into one. A US + Europe audience usually shows a bimodal pattern with a morning-US peak and an evening-Europe peak that often overlap. An Asia-Pacific audience adds a third peak. You schedule against each peak independently.
What if my heatmap shows almost no clear peaks?
A flat heatmap usually means one of two things: a very small audience (fewer than 500 active followers), where the sample is too small to produce visible patterns, or an unusually globally-distributed audience, where every hour has roughly equal activity. In the first case, grow the audience first; in the second, consider scheduling consistent volume rather than targeting peaks, since there are no strong peaks to target.

