
X will tell you how any single post did, but it will not hand you a ranked list of your year. To see your top tweets of the year on X, you need every post from those twelve months in one table, plus a metric to sort them by.
X's own analytics show stats one post at a time and open on a recent window, so a full-year ranking has to be built elsewhere. Circleboom lists the tweets in your history on X, narrows them to any date range, and sorts them by impressions, likes, retweets, replies or engagement rate, all through X's Enterprise API access.
→ See your top tweets of the year on X, ranked by any metric
The rest of this guide covers which metric to rank by, the eight steps, and what to do with the winners.
Why X never shows your top tweets of the year in one list
The question sounds simple, and that is why it frustrates people. You open a post, you see its impressions and likes, and you assume a "best of the year" view must exist one level up.
It does not.
If you want to see top tweets of the year on X, the platform leaves the ranking to you. X's analytics answer "how did this post do?" very well. They do not answer "which of my 900 posts this year did best?"
That gap matters more than it looks. A year-end review that starts from memory picks the posts you remember, which are usually the ones that got loud replies or the ones you were proudest of. Neither is the same as the posts that reached the most people or earned the most saves.
If you have ever tried to find your most popular tweet by scrolling your own profile, you know how fast that breaks down after the first few months.
The fix is a ranking, not a memory. Rank your top tweets of the year on X in one table, and the list stops being a guess. It becomes a record you can sort, read and act on.
Can X's own analytics rank a full year of tweets?
Not directly. To see your top tweets of the year on X with native tools alone, you work around the dashboard. It can show a longer period, but it does not rank posts by a metric, and its export works in small slices.
X's help page on the activity dashboard says it automatically shows the last 28 days, and you can change the date range in the top-right corner.
The same page sets two export limits: up to 30 days of data per export, and 3,000 posts per CSV file. It describes the dashboard as free for accounts with an ads account or an analytics.x.com registration.
Here is what those limits mean for a year-end review:
- A 365-day year divided into 30-day exports is 12.2 slices, so you need at least 13 separate downloads.
- Each file has to be merged with the others before anything is compared.
- The sorting, the engagement-rate math and the cleanup of duplicate rows all happen in your spreadsheet.
Thirteen CSV files and a spreadsheet is a project, not a review.
Many people also look for ways to check analytics on Twitter without Premium before choosing a route. For a ranked year in minutes, a table that already holds the posts and sorts them in place is shorter.
What Circleboom's Post Engagement Analytics does with your year
Circleboom's Post Engagement Analytics puts each tweet on its own row and each metric in its own column, so ranking a year becomes one click on a column header. It answers one question: which of my tweets performed best?
The data comes straight from X. Circleboom reads your tweet history as a partner X names in its Enterprise customer listing. The numbers you sort are X's own, pulled through approved access instead of scraping, and your account stays inside X's rules while you review it.
Three facts shape what the table can show you:
- It holds up to 3,200 of your most recent tweets, the window X's API returns for a standard account.
- Filters narrow the tweets already loaded; they never fetch tweets beyond that returned set.
- Engagement rate is calculated per tweet as engagements divided by impressions.
For most accounts, 3,200 recent tweets covers a full year with room to spare. A very active account that tweets dozens of times a day may find the start of its year outside the window.
This is the quickest way to see your top tweets of the year on X. Sort a full year of your tweets by impressions or likes, and the top of the column is your answer.
Which metric should define a top tweet on X?
Decide what "top" means before you see your top tweets of the year on X. The right metric matches what you wanted the tweet to do, and that differs for a creator chasing reach, a brand chasing clicks and a writer chasing saves.
| Metric to sort by | What a high number tells you | Use it when |
|---|---|---|
| Impressions | The post reached the most people | You report reach or awareness |
| Likes | The post earned quick approval | You want a simple crowd-favourite list |
| Replies | The post started conversations | You plan discussion or poll posts |
| URL clicks | The post sent people to a page | You promote links, launches or articles |
| Engagement rate | The post earned action per view | You compare posts of different reach |
Engagement rate needs one guard. A tweet with 40 impressions and 4 engagements shows 10%, which proves almost nothing. A tweet with 6,000 impressions and 150 engagements shows 2.5% on a sample big enough to trust.
Read engagement rate next to the raw numbers, never alone.
Clicks deserve their own pass if your account promotes anything. The posts with the most likes are not always the ones that sent traffic. Which tweets get the most clicks is a separate question, answered in the same table.
Age matters too. A January post has had eleven more months to collect likes than a December post, so compare late posts with each other.
How to see your top tweets of the year on X with Circleboom
You will connect your account, set the Date filter to the year you are reviewing, and sort the table by the metric you picked above. The whole run takes a few minutes once the account is connected.
Sorting a year of tweets by impressions, then trimming the list with date and engagement filters until the top posts stand out.
The eight steps below fall into three short phases.
Open Post Engagement Analytics in Circleboom
- Log in to Circleboom Twitter and connect the X account whose year you want to review.

- Go to the X Post Planner menu and choose Post Analytics.

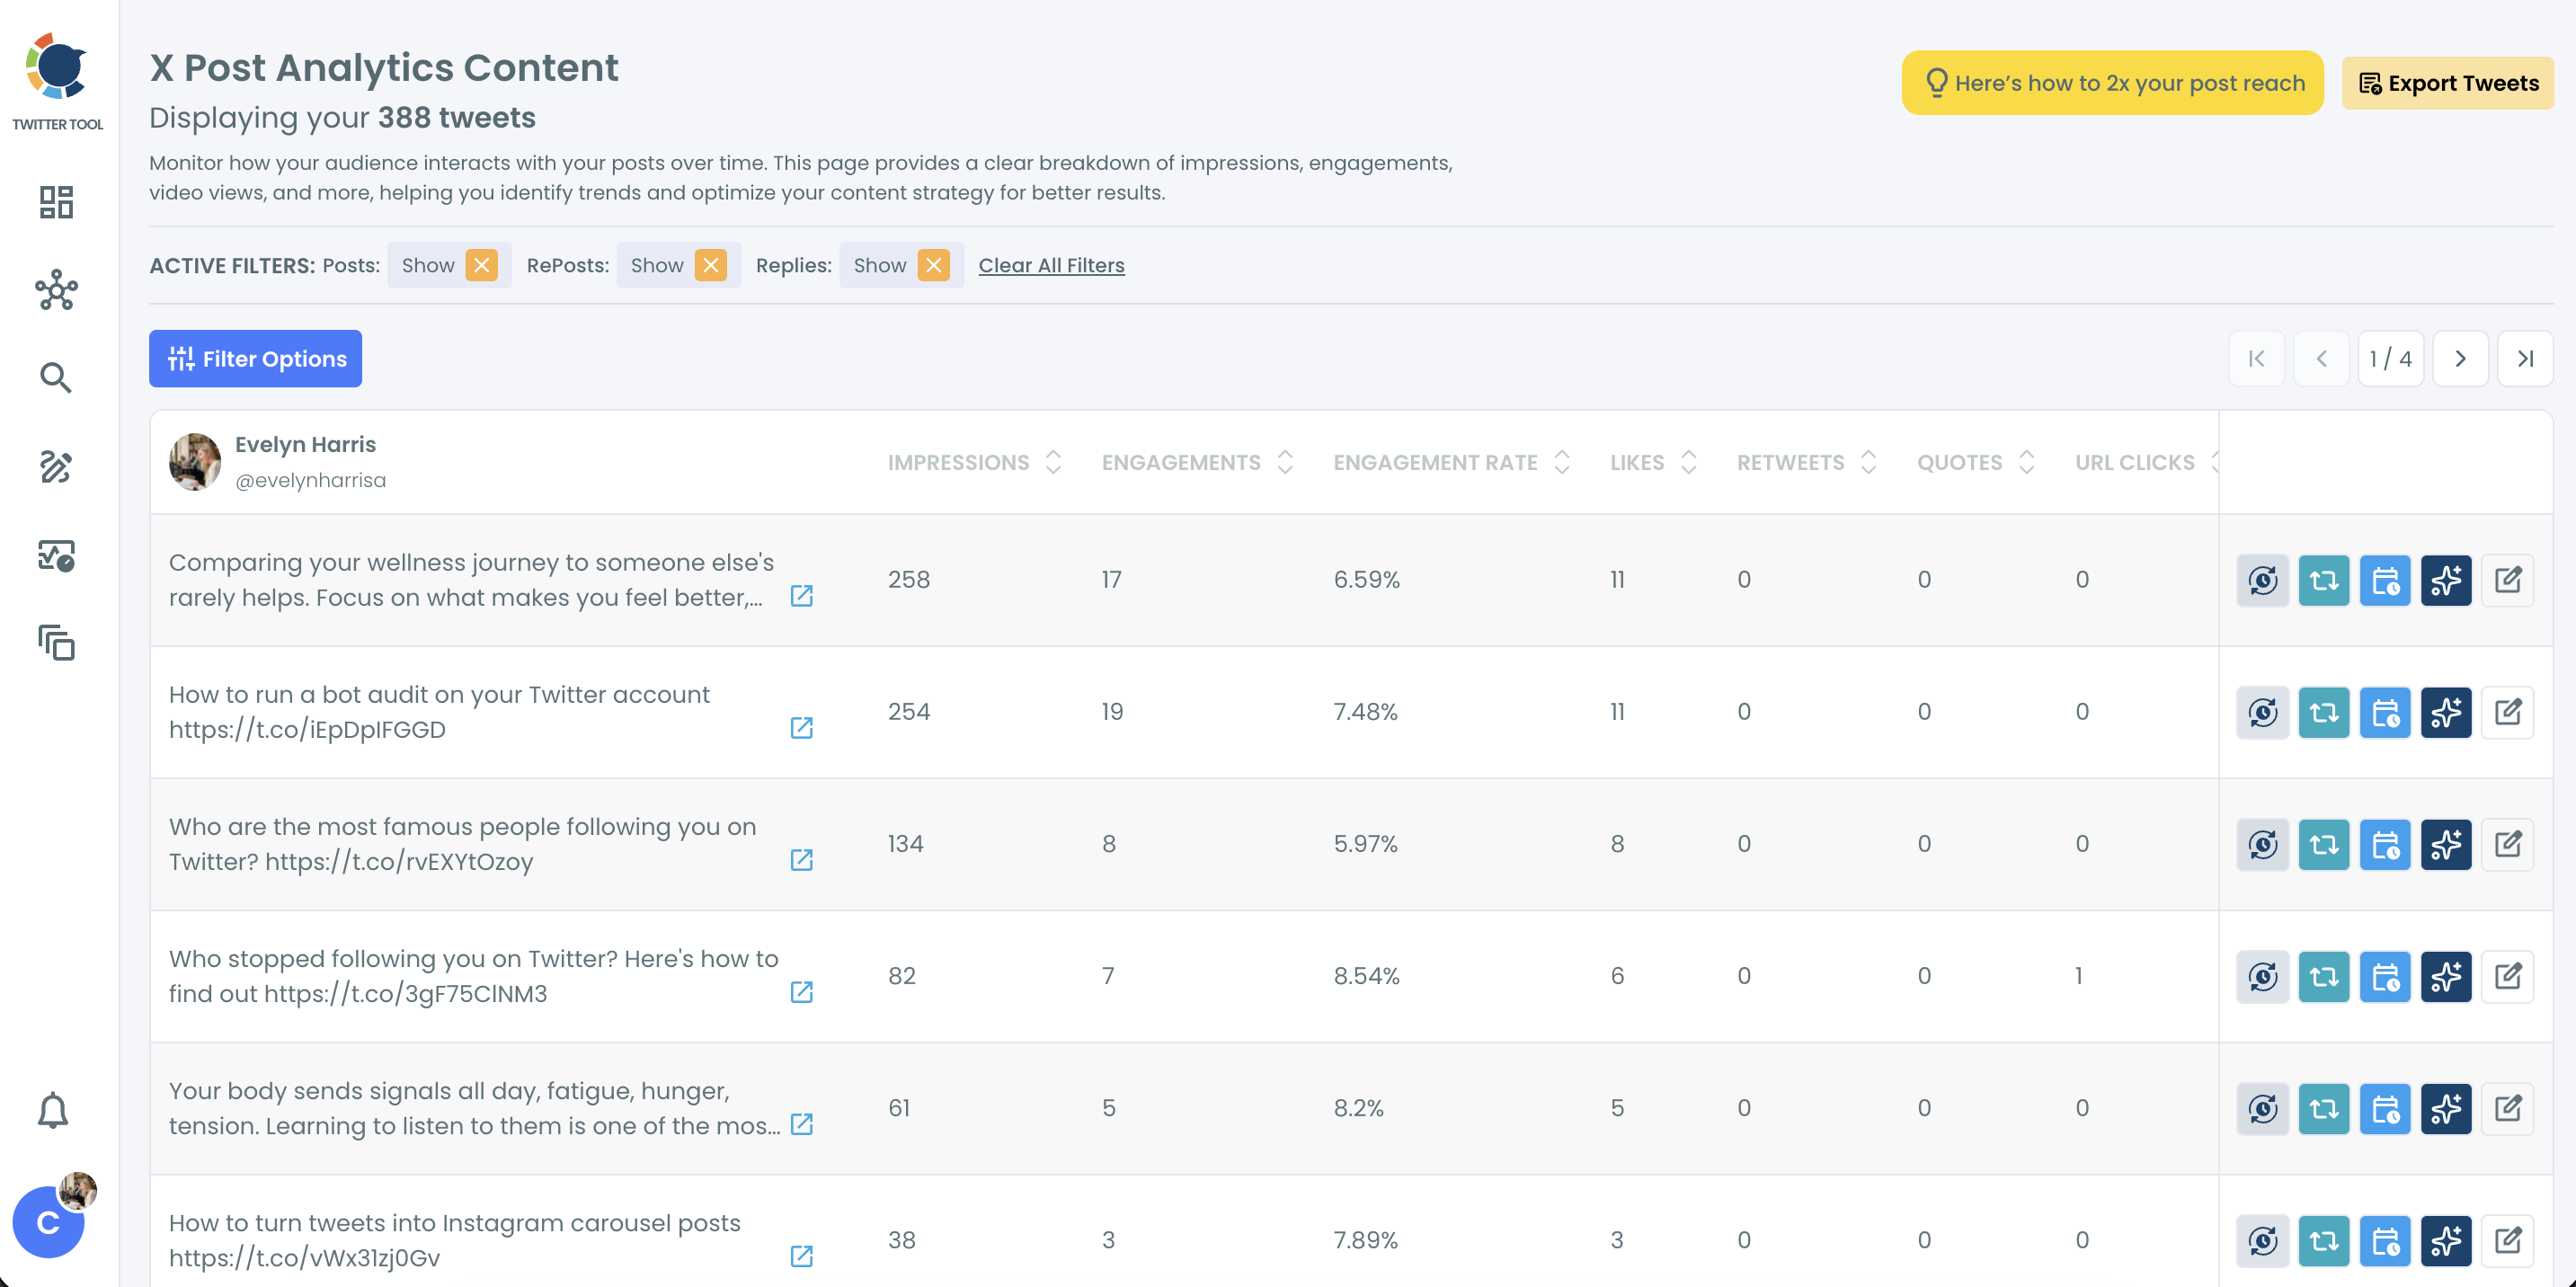
- Open the Content page of X Post Analytics, where each tweet appears with its impressions, engagements, engagement rate, likes, retweets, quotes and URL clicks.
Set the year as your date range
- Open Filter Options and set the Date filter so it covers the twelve months you are reviewing.
- Refine the set if you need to with Post Type or Exclude Some Tweets, so the ranking holds only the kind of post you want to judge, then select Apply Filters.
Rank the year and read the winners
- Sort the table by the column that matches your goal, highest first.
- Open the top ten tweets and read the full text and replies before you decide what made them work.
- Note the date range and filters you used, so anyone reading your review knows exactly which posts the ranking covers.
The order protects the result: the date range comes before the sort, so the ranking is built only from the year you meant, and reading the top posts before acting stops a single loud thread from steering next year's plan.
Before you leave, compare the year against the trend view. The Twitter post analytics overview shows account-level charts for the same period, and the ranked table explains which individual tweets built those peaks.
A rise driven by one exceptional post points to a different conclusion than steady growth across many posts.
How to reuse your best tweets of the year on X
Once you see your top tweets of the year on X, the best use of the ranking is a second round for the posts that already proved themselves. Each tweet in the table carries its own action buttons, so reuse starts on the same screen as the ranking.
Pick the action that matches what the tweet did well:
- Set auto-retweet on a post that people shared a lot and that is still true today.
- Reschedule a strong post that went out at a weak hour into a better slot.
- Rewrite with AI an older winner whose idea still holds but whose example has aged.
- Add to the reshare queue a post you want back in rotation without rebuilding it.
For the first one, the Twitter auto retweeter handles the repeat cycles.
For the second, the best time to post on Twitter shows when your own followers are online, which is where a rescheduled winner belongs.
Two rules keep reuse safe. Any reschedule or reshare must be set at least 15 minutes in the future, and an AI rewrite is only a draft until you publish or schedule it yourself.
Look past likes before you plan the next round
Bookmarks tell you something likes cannot: people wanted to come back. If you also want to see your most bookmarked tweets, those are the posts to expand into a thread or a longer resource next year.
The people behind the numbers are worth a look as well. The accounts that showed up on your best posts again and again are the ones to reply to and thank. You can find them through your most engaging followers on Twitter.
Some readers also want a benchmark from outside their own account. If a rival's best post is the comparison you need, how to see the most liked tweet of someone covers that side.
A year-end checklist for your top tweets on X
This is the order I would hand to anyone who wants to see their top tweets of the year on X for the first time, because it keeps the job from turning into an afternoon of scrolling:
- Set the Date filter to the exact year before you sort anything.
- Rank by the metric that matches each goal, and keep reach, clicks and saves as separate lists.
- Read the top ten posts in full, replies included.
- Give each winner one reuse action, and leave the rest of the list for planning.
- Write down the period and filters next to your notes.
Done this way, your top tweets of the year on X become the brief for next year: the hooks, formats and topics your audience already chose.
The account data behind every row reaches you through the Enterprise customer directory X publishes, so the ranking reflects X's own metrics rather than an estimate. When you are ready to run it, start here:
→ Find your top tweets of the year on X in Circleboom
Year-end top tweets on X: questions before you run the review
Why do some of my older tweets show no impressions?
Impression data may be unavailable for some older tweets or for tweets posted before your account connected to Circleboom. When impressions are missing, engagement rate cannot be calculated for that tweet, so rank those posts by likes, retweets or replies instead.
What should I do with the tweets that flopped this year?
Sort the same table from lowest to highest to see the posts with no likes or retweets. Post Engagement Analytics is not the deletion workflow, so remove them with delete low-engagement tweets, which has its own like and retweet filters.
How do I present my top tweets of the year on X to a client or team?
Share the ranked list together with the date range and filters you used, so the reader knows which posts the conclusion covers. Keep reach, clicks and engagement rate as separate rankings, because each answers a different question about the year.
How fresh are the numbers in the ranking?
Circleboom reads the metrics from X when the data loads, so the values match X at that moment. A tweet that is still collecting likes can show a slightly lower number until the next refresh, which matters most for posts from the last days of the year.