Reading post analytics through the X API costs $0.005 per post for the metrics, on top of reading the post itself, so refreshing the numbers for 3,200 posts costs about $19.20 every time. Refresh daily and that is roughly $576 a month before a single chart exists. Circleboom is an Official X Enterprise Developer and shows the same official X metrics in charts and sortable tables as part of its plans, which comes out up to 92 percent cheaper than a daily X API refresh.
Your posts are getting impressions, likes and link clicks. You want to know which ones worked, and whether last month was better than the one before.
X’s own analytics show a single post when you click on it and a short recent summary, and sometimes you can’t see your tweet analytics at all. There is no way to sort your full history by impressions or to compare two months side by side. So the next idea is the X API, where the numbers are available in bulk.
Then the bill starts ticking. The API charges for the metrics, charges again for the posts, and charges again every time you want fresh numbers. With Circleboom Twitter, you can see your X post analytics as charts and a ranked table of every post, refreshed from official X data, without paying per post or writing code.
What the X API charges for analytics
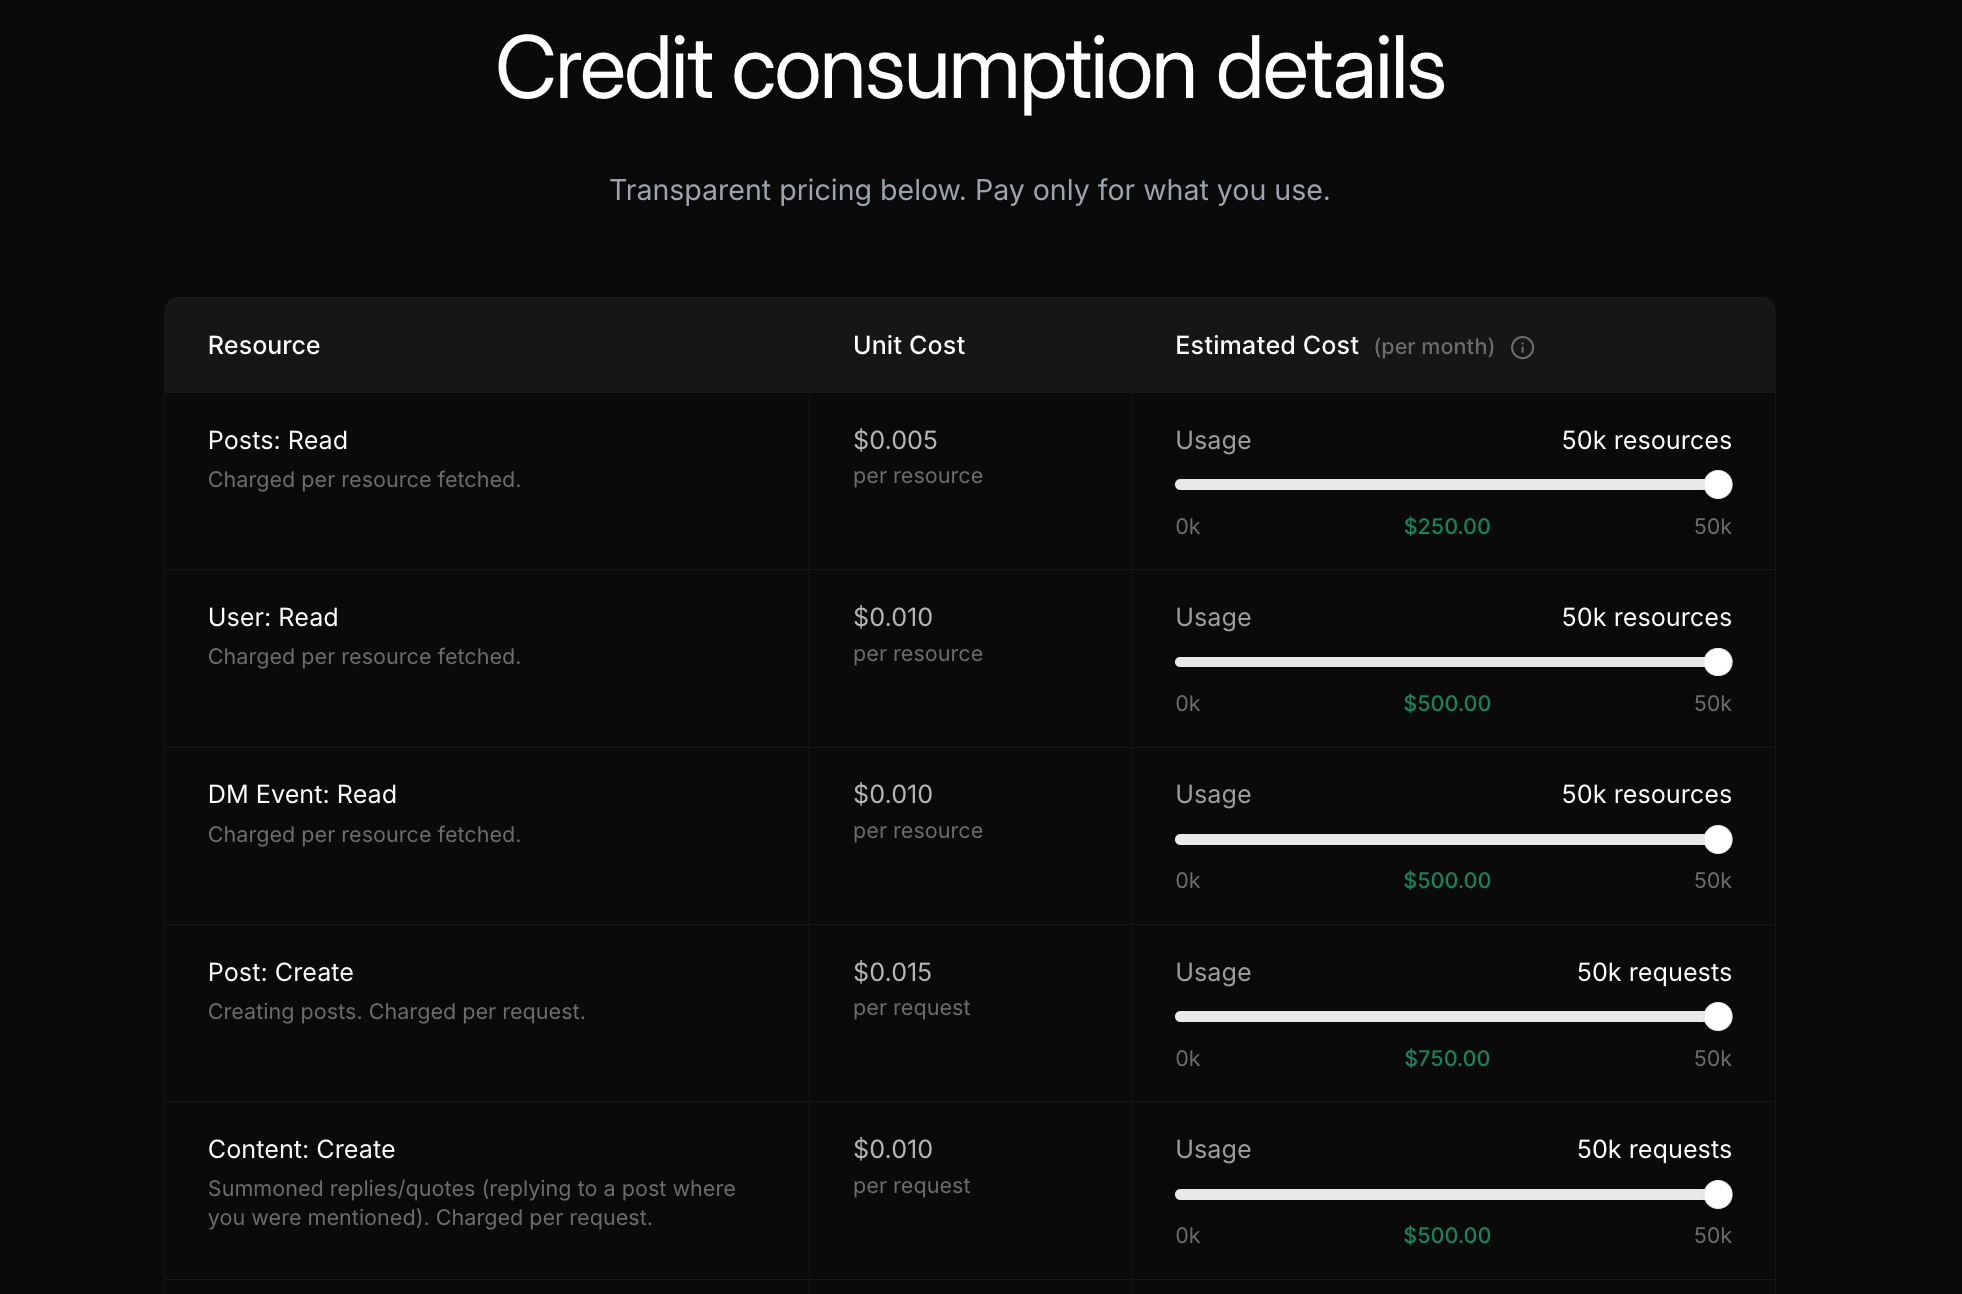
X’s API runs on pay-per-usage credits. The official X API pricing page lists these lines for post performance data:
- Analytics: Read costs $0.005 per resource
- Owned: Read costs $0.001 per resource when you read your own posts with your own developer app
- Posts: Read costs $0.005 per post otherwise
- Media: Read costs $0.005 per media item
That gives the formula for one refresh of your numbers:
X API analytics cost per refresh = posts × ($0.001 owned read + $0.005 analytics read)
So for the 3,200 most recent posts, the window the API returns for a timeline:
- One refresh: 3,200 × $0.006 = $19.20
- Weekly refresh: about $76.80 a month
- Daily refresh: about $576 a month
Without your own developer app, the post read is billed at the standard $0.005, and one refresh of 3,200 posts becomes $32.
Analytics on the X API is not a one-time purchase. Every time you want fresh numbers, you pay for every post again.
Same official X metrics with Circleboom
Circleboom is listed in X’s Enterprise customer directory as an Official X Enterprise Developer. Its analytics tools retrieve post metrics for your connected account through the official X Enterprise API, so the impressions, likes and clicks you see are X’s own numbers.
Three tools cover what developers usually build on top of the API:
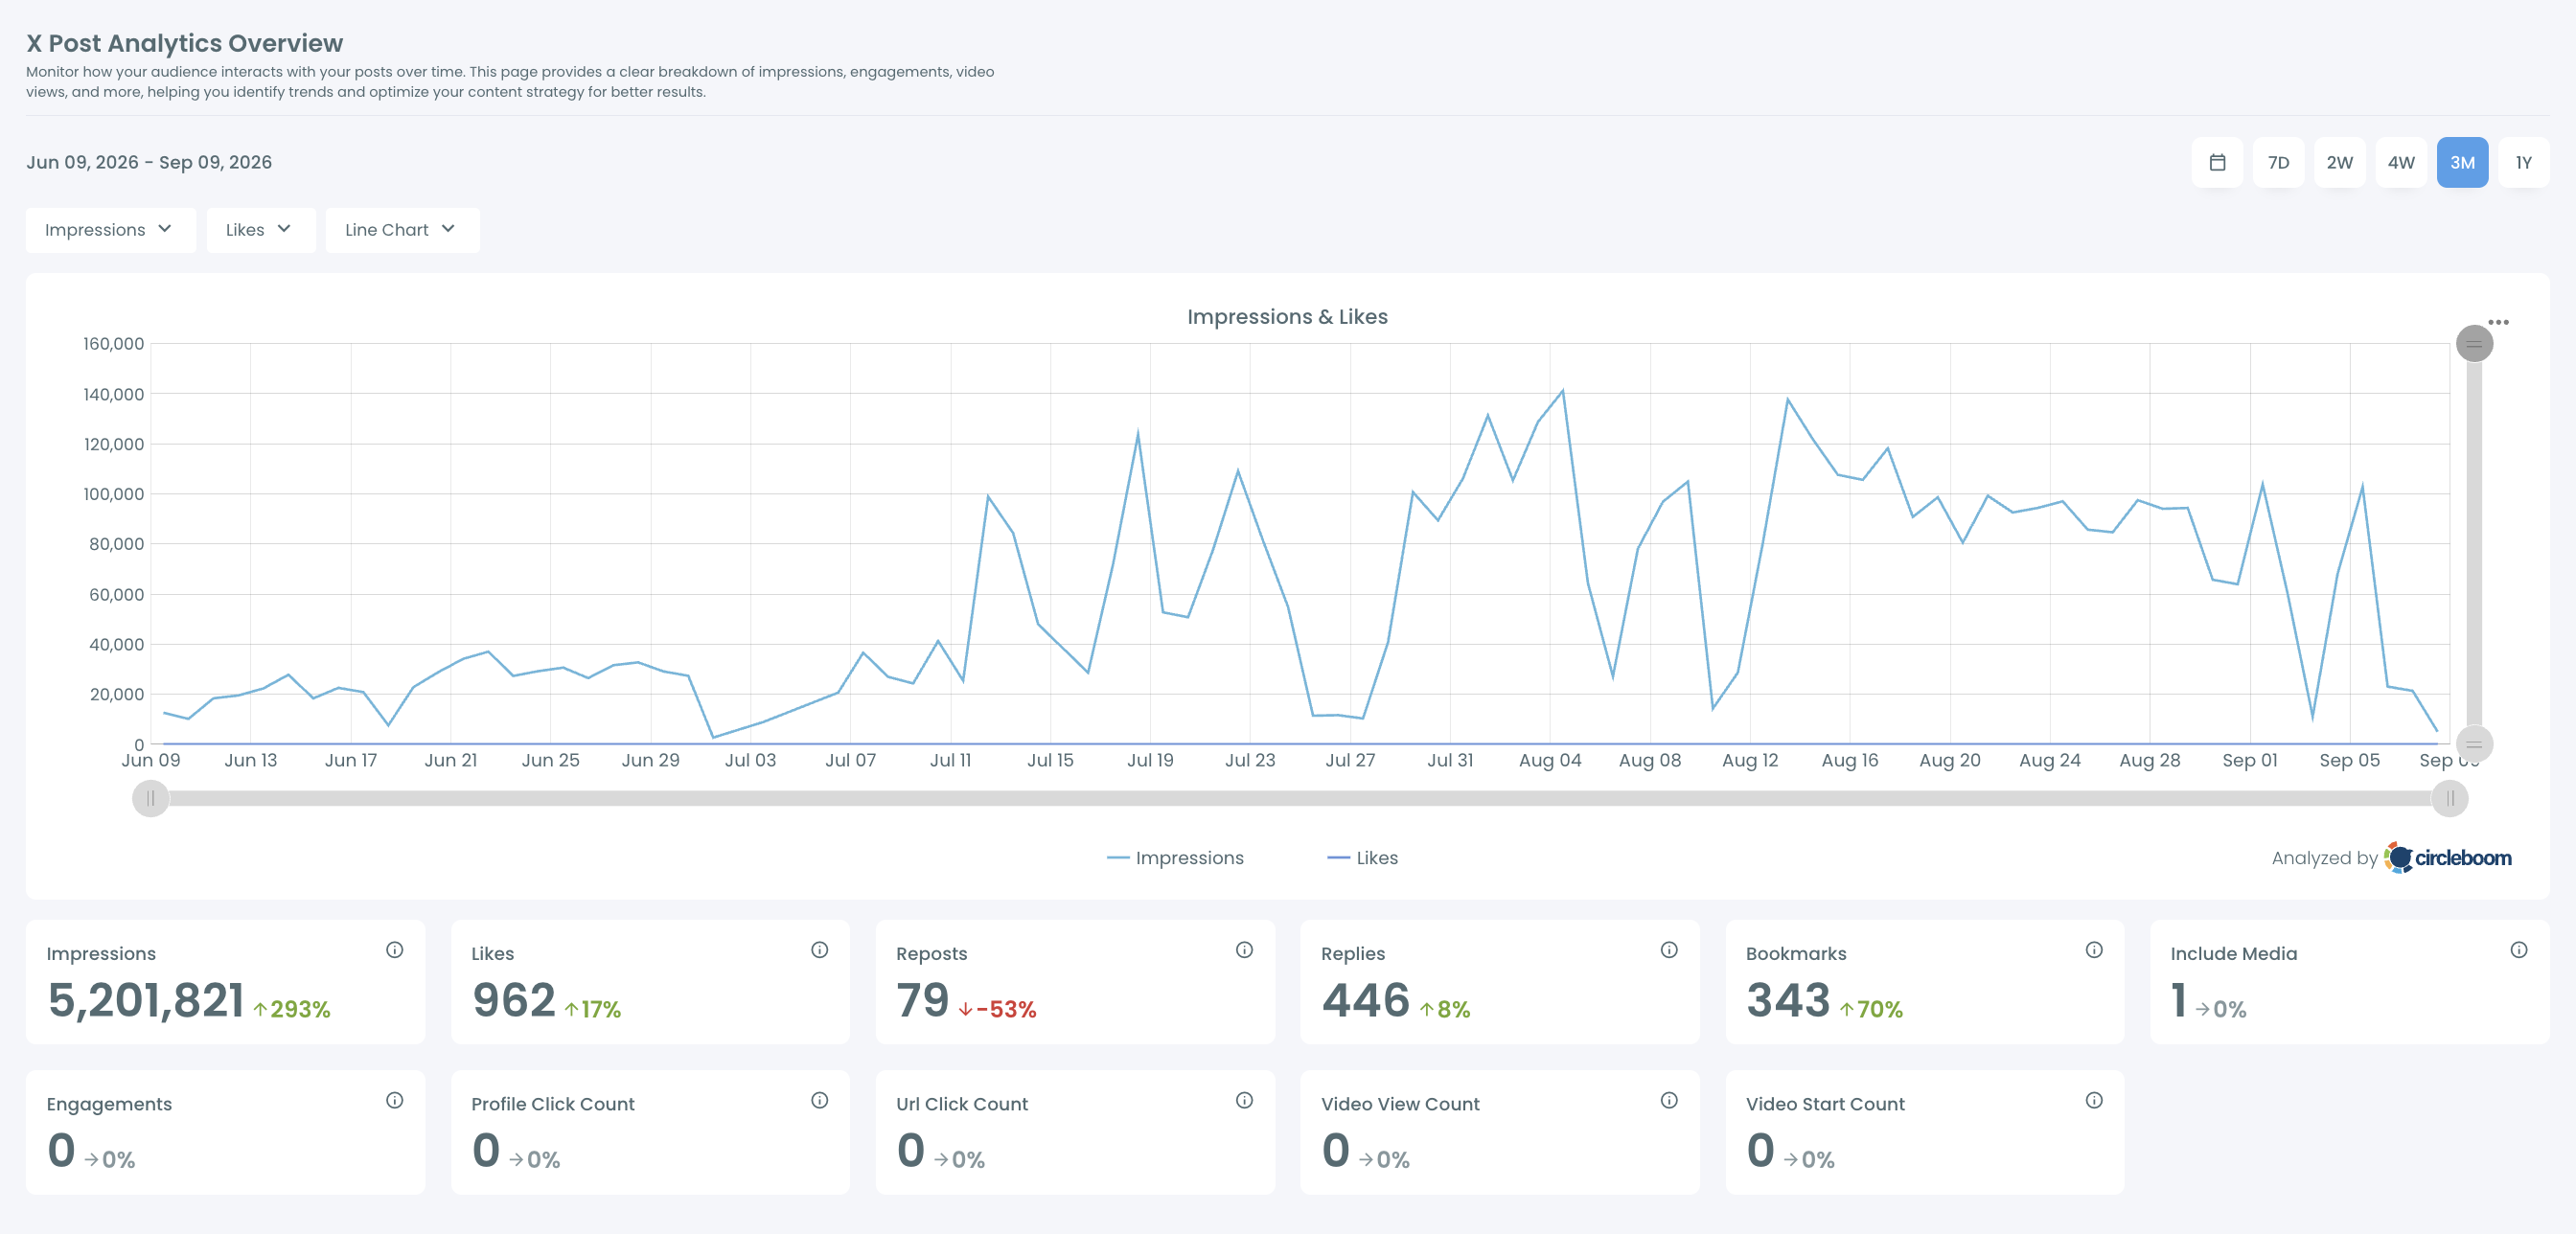
- Post Analytics Overview & Graphs turns your posts into line and bar charts for impressions, likes, reposts, replies, bookmarks, engagements, profile clicks, URL clicks and video views, with summary cards that show the change against the previous period
- Post Engagement Analytics lists every post in a sortable table, so you can rank your history by impressions, likes or engagement rate
- Video Analytics separates video performance with views and starts
Engagement rate in the table is calculated by Circleboom as engagements divided by impressions for each post. On the X API, that is one more formula you would have to write.
X API analytics cost vs Circleboom: a worked case
Here is the full calculation for a typical brand account.
The case: a brand wants daily numbers for its last 3,200 posts to spot which topics and formats are working.
On the X API, per month: 3,200 posts × $0.006 × 30 refreshes = $576 Then add the developer work: authentication, pagination, storage, daily jobs and a dashboard someone can actually read.
On Circleboom: Post analytics comes with the Circleboom plan, along with follower analytics, search and scheduling. Plan prices are on the Circleboom plans and pricing page.
The savings formula:
Savings % = (X API cost - Circleboom cost) ÷ X API cost × 100
Put the Pro plan’s monthly price into the formula, counting the whole plan against analytics alone, and the result is about 92% less than a daily X API refresh. Even against a weekly X API refresh, Circleboom is about 37% cheaper.
A daily view of your own numbers costs about $576 a month on the X API. On Circleboom, it is one part of a plan that does much more.
📌 X API rates come from X’s official pricing page at the time of writing, and Circleboom plan details from its public pricing page. Both can change, so rerun the formula with your own post count and refresh schedule.
How to read your X analytics with Circleboom
- Log in to Circleboom Twitter and connect your X account through X’s official login.
- Open X Post Analytics and pick a date range. The overview charts show how impressions, likes and other metrics moved across the period you choose.
- Switch the chart metrics. Compare impressions with likes, bookmarks or URL clicks, and switch between line and bar charts.
- Open the content table and sort it. Rank every post by impressions, likes, engagement rate or clicks to find your top performers.
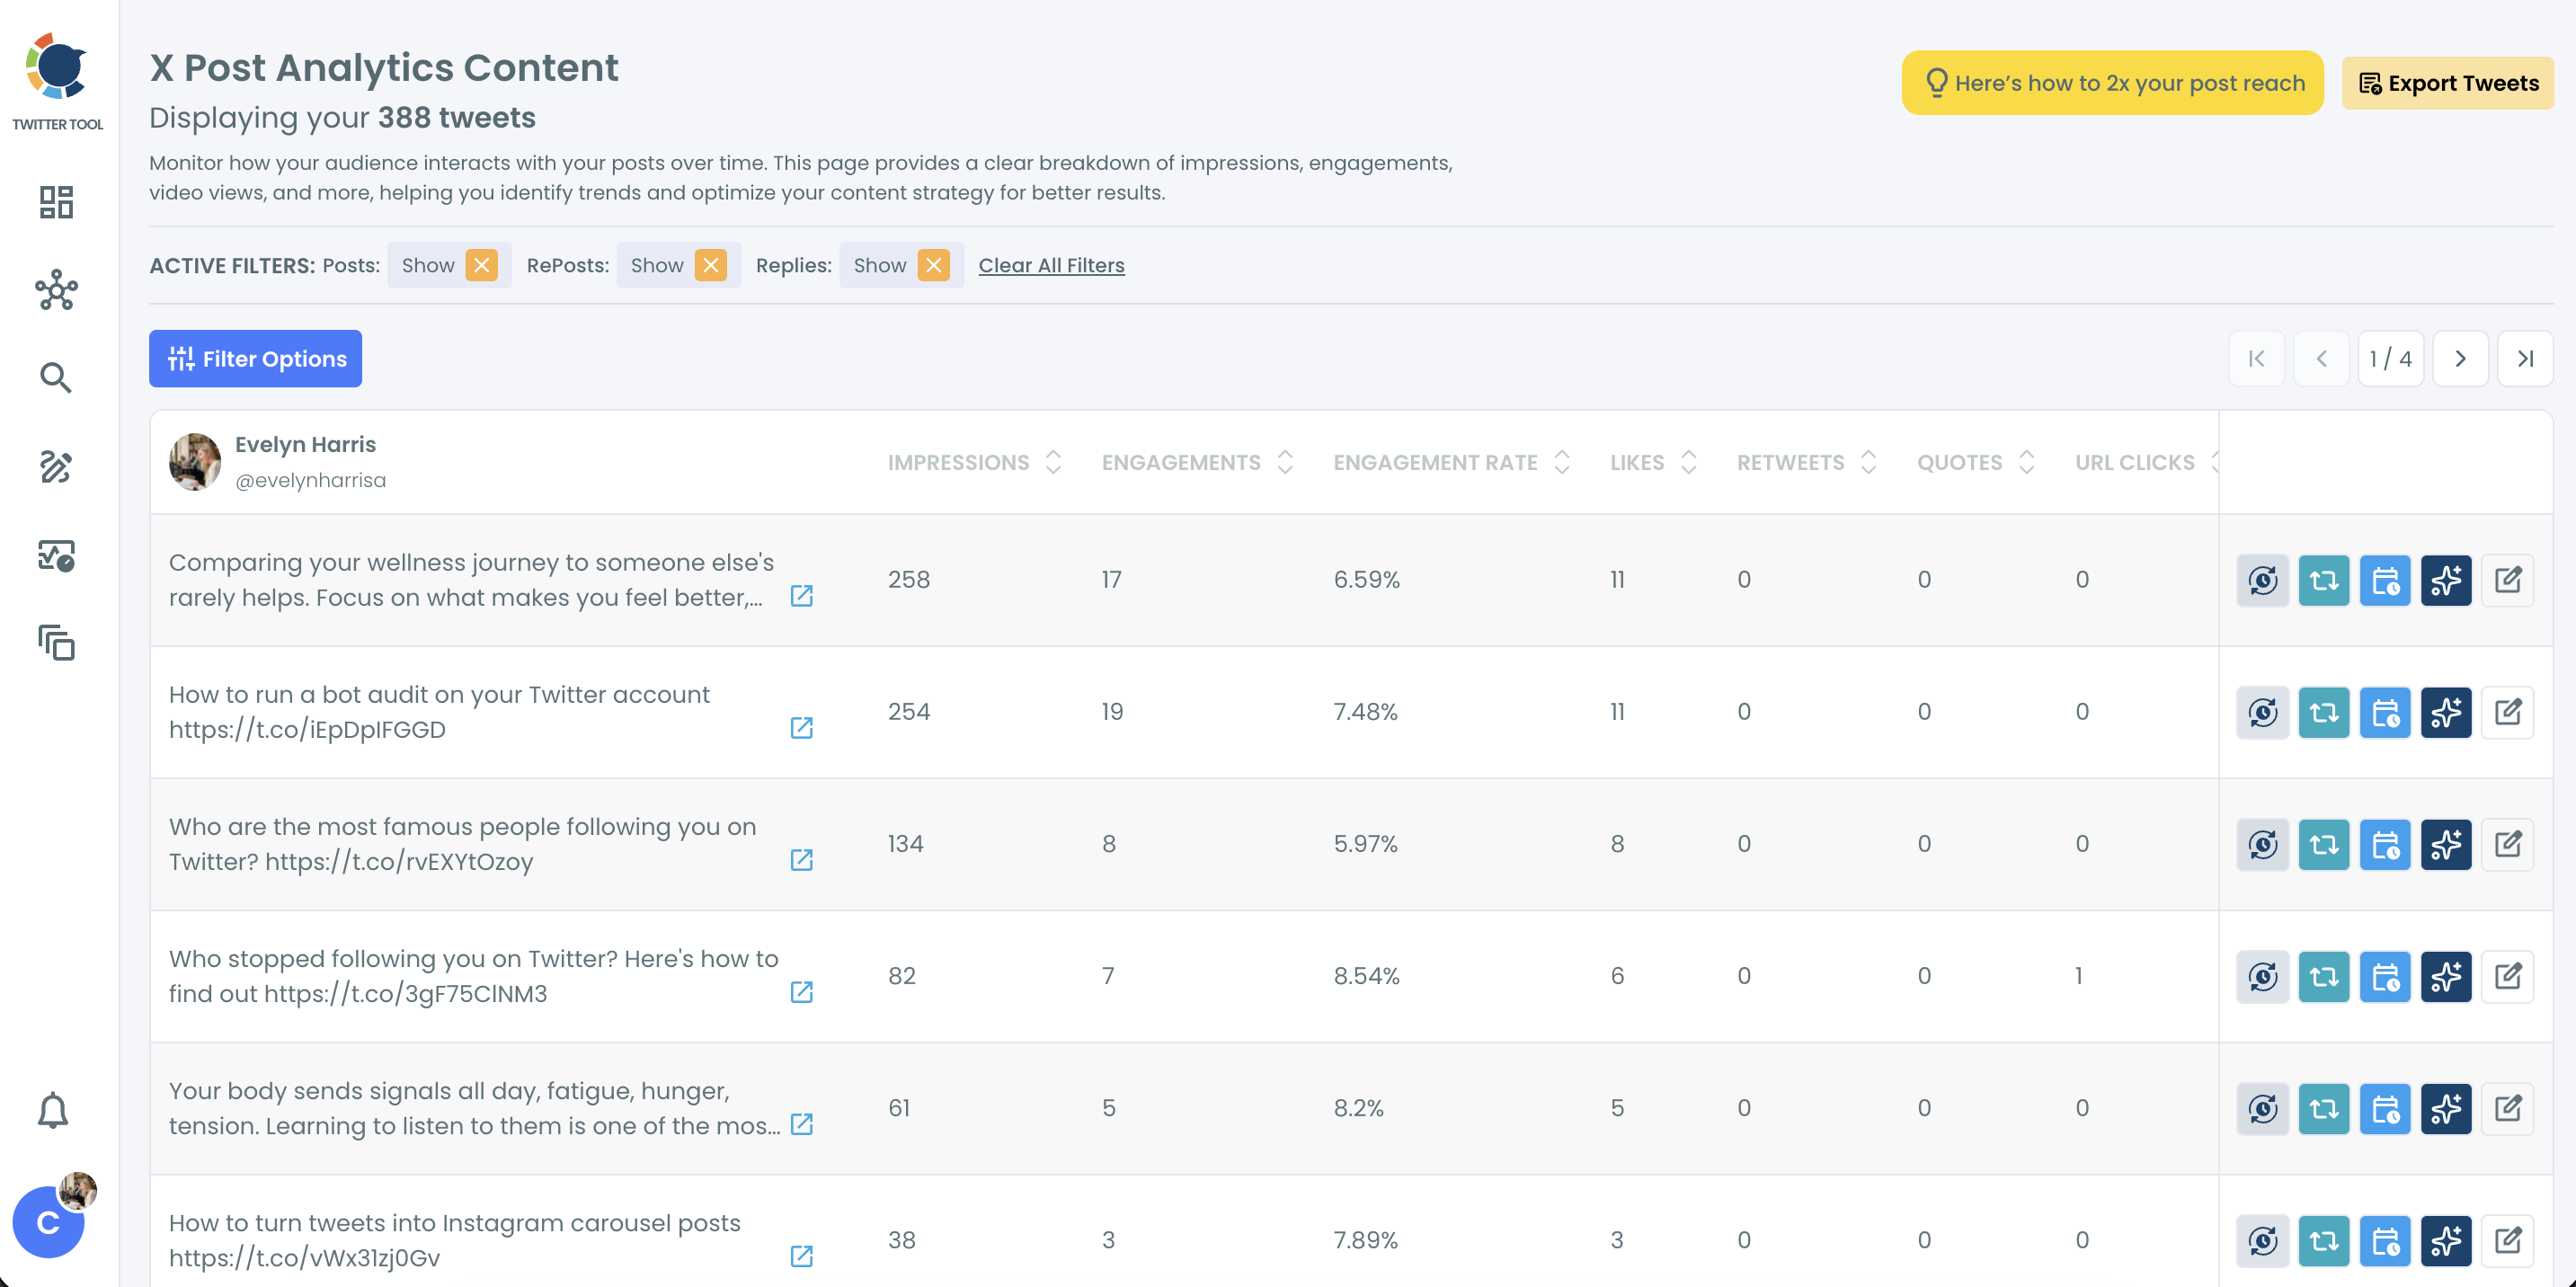
- Act on what you learn. Use the per-post buttons to queue a top post again, reschedule it or rewrite it with AI in X Post Planner.
Our guides on what to tweet based on past post analytics and on Twitter content performance analysis show how to turn the table into a content plan.
Why the X API price is only part of the bill
The per-post price is what X charges. Building around it is what you pay.
Analytics through the API means a scheduled job that pulls metrics, a database that keeps every day’s numbers, and charts that compare periods. Each test run and each failed job that retries reads the posts again, and each read is billed again. X deduplicates the same resource only within a 24-hour UTC window, and calls that a soft guarantee.
On the X API, a dashboard is not a feature. It is a project you build, host and pay for every day.
There is also the Premium question. X’s native analytics give more detail to X Premium subscribers, which is why so many people search for how to check analytics on Twitter without Premium. Circleboom shows the metrics as part of its own plan, with no X Premium subscription needed for the dashboard.
What people actually use post analytics for
Most people who look up the X API analytics cost want answers, not raw metrics:
- Finding top posts: which posts to reuse, thread or repost, the core of how to see tweet analytics the useful way.
- Tracking reach: how to see your total impressions on X and how to increase Twitter post impressions.
- Judging engagement: comparing against what a good engagement rate on X is.
- Reporting: pulling numbers for clients or managers, as covered in how to export Twitter analytics.
- Comparing tools: our roundup of the best Twitter analytics tools and the complete guide to tweet activity metrics.
- Choosing the right metrics: the key Twitter performance metrics you should track.
With Circleboom Twitter, each of these starts from a chart or a sorted table on X instead of a daily API bill.
FAQ
How much does the X API charge for analytics?
X’s pay-per-usage pricing lists Analytics: Read at $0.005 per resource. Reading the posts themselves adds $0.001 each on your own developer app, or $0.005 at the standard rate. One refresh of 3,200 posts costs about $19.20 on your own app.
How much does a daily analytics refresh cost on the X API?
At $0.006 per post, refreshing 3,200 posts every day costs about $576 a month. A weekly refresh costs about $76.80 a month.
Is Circleboom’s analytics data the same as the X API data?
Yes. Circleboom is an Official X Enterprise Developer and retrieves post metrics for your connected account through the official X Enterprise API. Engagement rate is calculated by Circleboom from those metrics.
How much cheaper is Circleboom than the X API for analytics?
Counting the whole Pro plan price against analytics alone, Circleboom is about 92% cheaper than a daily X API refresh of 3,200 posts. The plan also includes follower analytics, search and scheduling.
Do I need X Premium to see my analytics in Circleboom?
No. Circleboom’s post analytics come with its own plan and work for your connected X account without an X Premium subscription.
How many posts does Circleboom analyze?
Post Engagement Analytics works on up to the 3,200 most recent posts, which is the window the X API returns for an account’s timeline.
Final thoughts
On the X API, your own numbers are something you rent again every time you look at them. That fits a developer building an analytics product. For a creator or a brand that just wants to know what worked, it means a daily bill and a dashboard to build.
Circleboom shows the same official X metrics as charts and a ranked table inside your plan, so the only thing left to do is act on them. Open your post analytics with Circleboom Twitter: