

Twitter view counts are inflated by autoplay and don't reflect engagement. Watch rate, broken into 25%, 50%, 75%, and 100% milestones, is the actual signal of video quality. Most accounts have been celebrating videos with 5–8% completion rates because the view count looked impressive; the retention chart tells the real story.
→ Check Twitter video retention by milestone
The rest of this article explains why view counts are misleading, what retention milestones actually measure, and how the metric flips the entire video content strategy.
There's a quiet category of metrics that look like they're telling you something useful and aren't. Twitter video view counts are the canonical example. They're prominently displayed on every video tweet, they're large numbers (often larger than the comparable metric on other platforms), and they correlate with the feeling that a video worked. None of which makes them informative.
The reason is the play threshold. Twitter triggers a view at a level of engagement most viewers will never deliberately reach: autoplay scrolling counts, a second of attention counts, accidental taps count. The view count includes the entire population of people who passed your video on their timeline, not just the population that actually watched it. A 50,000-view video and a 500-view video can have the same number of genuinely engaged viewers if the 50,000-view version has 1% completion and the 500-view version has 100%.
Watch rate makes the distinction visible. The retention milestones split the view count into stages that reflect actual viewing behavior. The view count gets you to the baseline; the watch rate tells you who stayed.
What the Milestones Actually Tell You
Five retention stages, each measuring a different dimension of video quality:
- Video Started: The inflated baseline. Most "starts" on Twitter are passive autoplay scrolls, not deliberate plays.
- 25% Watched: The first quality filter. Reaching this stage requires either deliberate engagement or sustained attention. Started-to-25% drop-off measures hook strength.
- 50% Watched: The pacing filter. The viewer is committed enough to be halfway through. 25%-to-50% drop-off measures how well the body holds attention past the opening.
- 75% Watched: The engagement filter. By this point viewers usually finish unless the closing weakens. 50%-to-75% drop-off measures sustained engagement.
- 100% Watched: Full completion. The strongest single-number quality signal. 75%-to-100% drop-off measures closing strength.
The pattern across these milestones is the actual diagnostic. A steep Started-to-25% drop with stable retention afterward is a hook problem. A clean 25% with collapse at 50% is a pacing problem. Strong retention through 75% with a sharp 100% drop is a closing problem. Reading the pattern produces specific fixes; reading only the completion rate produces vague "make better videos" feedback. The same framework applies cross-platform, and anyone studying how different types of visual content impact engagement on social media reaches similar conclusions about retention curves as the universal signal.
Circleboom is listed in X's enterprise customer directory, which is what makes the retention data accessible without X Premium. The Enterprise API exposes the milestone breakdown that the native interface keeps behind the paid tier.
Why the View Count Persists as the Wrong Metric
Three reasons view counts dominate video discussion even though they're not very informative:
The first is prominence. Twitter displays the view count below every video tweet. The number is large, visible, and updates in real time. Retention data isn't displayed natively for most accounts; you have to look for it deliberately. Prominence drives attention; attention drives the perception of importance.
The second is comparison. View counts feel comparable across videos, accounts, and platforms in a way watch rate doesn't. "12,000 views" feels like a meaningful number; "12% completion rate" requires more interpretation. The simpler metric wins by default even when the simpler metric is less informative.
The third is direction. View counts almost always go up over time as more viewers see the video. Watch rate is roughly constant after the first 48 hours; it doesn't have the same "growing" feel. Metrics that visibly grow attract more attention than metrics that stabilize. Anyone tracking how to delete low-engagement tweets on mobile fast and safely has run into a related pattern: visible-growth metrics dominate decisions even when they're not the right metrics to optimize against.
The combined effect is that creators optimize for view counts (an inflated, weakly-informative metric) instead of watch rate (a precise, diagnostic metric). The misalignment produces videos that look successful but underperform on actual engagement.
Video walkthrough: how to analyze tweet impressions and engagements in depth.
How to Switch Your Analysis to Watch Rate
Four steps from login to a retention-driven content workflow.
The new routine
- Log in to Circleboom Twitter and authorize with OAuth.

- Open the X Post Planner menu from the sidebar.
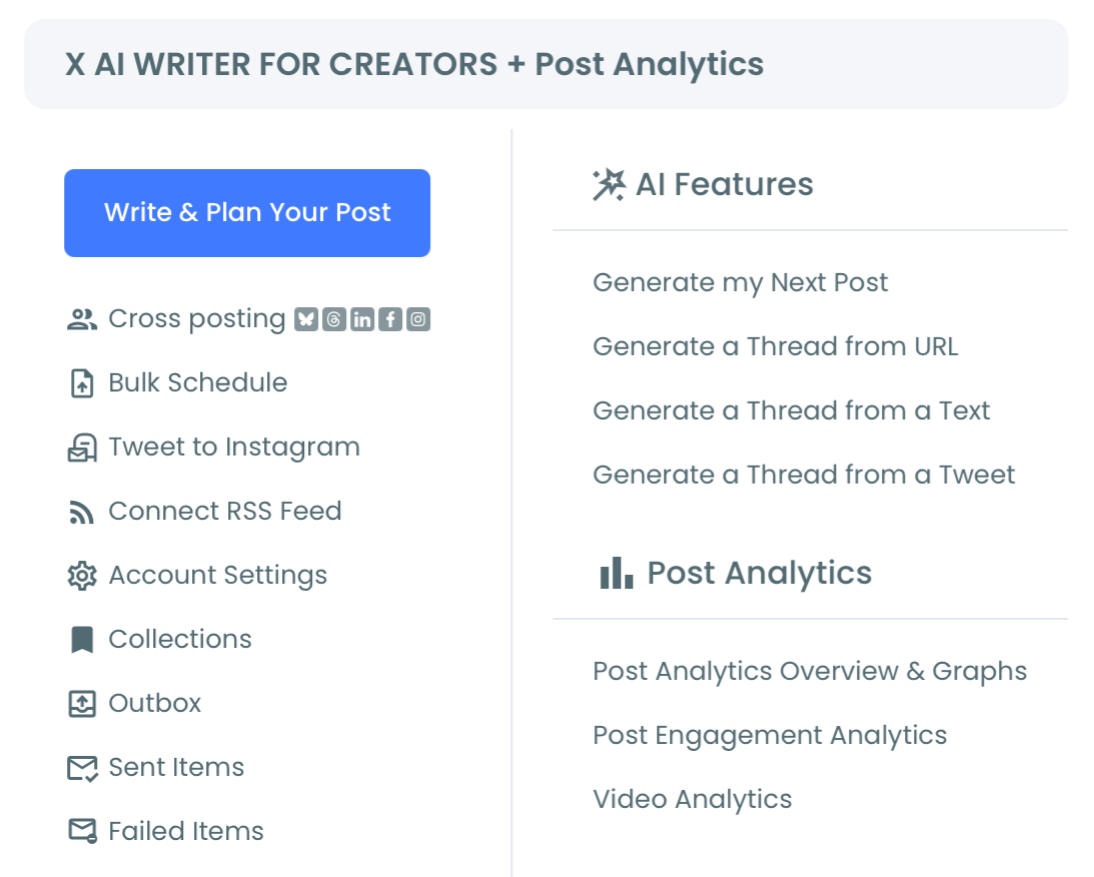
- Navigate to Post Analytics, then Video Analytics, and pull up the retention chart for every video published in the last 30 days. This is the baseline pass: see the current pattern across your content.
- Identify the most common drop-off pattern across your videos and write down the specific fix it points to. If most videos lose viewers at the 25% mark, your hooks need work. If most lose viewers between 50% and 75%, your pacing needs work. The pattern across multiple videos is more reliable than the pattern in any single video. Tools like Circleboom's Twitter video analytics workflow and the broader post analytics suite make this cross-video read fast.
That sequence is the operational core. The single-video chart is useful; the multi-video pattern is where strategy decisions emerge.
What Happens to View Counts When You Optimize Retention
Counterintuitively, view counts go up when you optimize for retention, not down. The mechanism is Twitter's algorithm: the platform rewards engaged viewing with more impressions. A video with high retention gets shown to more people, which produces more views, which compounds with better retention into a larger engaged audience.
The reverse is also true. A video with low retention gets show to fewer people over time even if it had high initial impressions. The platform reads the retention signal and pulls back distribution. Optimizing for view counts directly (clickbait hooks, sensational framing) often produces a short-term view spike followed by reach decay; optimizing for retention produces a slower but sustained reach lift.
The longer-term pattern is what matters. Creators who shifted to retention-first analysis usually see view counts move within a few weeks, with the most retention-optimized videos producing the largest view jumps. The view count isn't the wrong direction to look; it's the wrong direction to optimize. Optimize retention; let the view count follow. The same logic underlies content auto-posting workflows like YouTube videos posting to Twitter automatically: the distribution channel is downstream of the content quality signal.

The Bottom Line
Twitter view counts are an inflated, weakly-informative metric that dominates video discussion because they're prominent and feel comparable. Watch rate is the precise, diagnostic metric that actually reveals what's happening with your video content. The milestone breakdown (25%, 50%, 75%, 100%) surfaces specific failure points and points to specific fixes. The fix produces better retention; the retention produces better distribution; the distribution produces the view counts you thought you cared about in the first place.
Switch the metric. Stop opening the post and looking at the view count. Start opening Video Analytics and reading the retention chart. The data changes the content strategy, and the content strategy changes the outcomes.
→ See Twitter video drop-off charts now

Still Wondering?
Why doesn't Twitter make retention data more prominent?
Probably because the native interface is built for general use, not for creator analytics. The detailed retention data exists in the underlying platform metrics; the native UI surfaces a simplified version. Tools that access the Enterprise API can expose the milestones directly, which is what Video Analytics does.
Should I delete videos with bad retention?
Usually not. Videos with poor retention don't actively harm your account; they just don't help. Leaving them up is fine. The value of the retention data is forward-looking: it tells you what to change about your next video, not what to do with past ones.
Can I measure watch rate on competitor videos?
Not directly. The Enterprise API exposes retention data for accounts you have authorized access to, not for arbitrary public accounts. You can study competitor content qualitatively (length, hook structure, pacing) but not their retention numbers.
How long does it take to see retention improvements after I change my approach?
Usually 2–4 videos. The next video after a structural fix should show a measurable retention shift if the fix addressed the right problem. If three or four videos don't move the needle, the diagnosis was wrong and the actual cause is elsewhere.
Will watch rate matter if Twitter's algorithm changes?
Retention is a near-universal video quality signal across platforms; algorithms come and go but engaged viewing remains the upstream metric that platforms use to decide which content to distribute. Watch rate will keep mattering even if the specific weighting changes.


)