The definition of engagement in social media is simple to state: engagement is any action a person takes on a post after seeing it. That covers a like, a reply, a share, a save, a repost or the seconds spent watching.
Measuring it is harder, because every platform counts a slightly different set of actions.
What is engagement on social media?
Engagement is every visible action people take on your post, from likes and replies on X to saves on Instagram and watch time on YouTube, and Circleboom Publish measures those actions per post across X, Instagram, Facebook, LinkedIn and six more platforms.
→ Measure engagement on every social media post you publish
What engagement means on social media
Engagement on social media means interaction: the moment a viewer stops being a passive scroller and does something with your post. Seeing a post is not engagement. Reacting to it, answering it, keeping it or passing it on is.
The common engagement actions fall into four groups:
- Reactions: likes, hearts and Facebook's seven reaction types.
- Conversation: comments, replies and quote posts.
- Distribution: shares, reposts and sends in direct messages.
- Intent: saves, bookmarks, profile visits and watch time.
The groups are not equal. A like costs the viewer half a second. A reply costs a thought, and a save says the viewer plans to come back.
When you read social media engagement, the heavier actions tell you more than the lighter ones, even when they show up in smaller numbers.
A post with fewer likes and more saves is often the post that worked.
In our view, that is the problem with most engagement reports: they add every action into one total and lose the difference between a tap and a decision.
Before you build your own definition, it helps to track likes, comments, shares and saves per post instead of reading one blended number for the whole account.
Circleboom Publish breaks each post's engagement into its separate actions on X, Instagram, Facebook, LinkedIn and every other platform it schedules to, so the heavy signals do not disappear inside the total.
Is a like the same as an impression on X?
No. An impression counts how many times a post was shown on a screen, while a like counts a person who acted on it. Impressions measure exposure, and engagement measures response.
The difference matters most on X, where both numbers sit next to each other under every post. A post can collect thousands of impressions and almost no likes, replies or reposts, which means people saw it and kept scrolling.
If you are unsure how the two counters relate, the answer to do likes count as impressions on Twitter separates them with X's own logic.
Reach is the third term people mix up. Reach counts the unique accounts that saw a post, so one person who scrolls past twice adds two impressions and one reach.
Exposure numbers tell you a post was delivered; engagement numbers tell you it was worth stopping for.
Keep the two apart in every report. When engagement falls but impressions hold steady, the content is the suspect. When both fall together, look at timing or distribution first.
Engagement signals by platform
Engagement on social media is not one universal list of actions. Each platform counts its own set, and each one weighs a different action as the strongest sign that a post landed:
| Platform | What counts | Strongest signal | Where to read it |
|---|---|---|---|
| X | Likes, replies, reposts | Replies and reposts | Post engagement table |
| Likes, comments, saves, shares | Saves and DM shares | Post table, sorted by saves | |
| Seven reactions, comments, shares | Comments and shares | Reaction mix per post | |
| Reactions, comments, reposts | Comments | Page Content tab | |
| Threads | Likes, replies, reposts, quotes | Replies and quotes | Post engagement table |
| Bluesky | Likes, reposts, quote posts | Quote posts | Post engagement table |
| Saves, outbound clicks | Saves | Pin performance | |
| YouTube and TikTok | Watch time, retention | Video retention | Video funnel |
| Google Business Profile | Calls, direction requests | Customer actions | Listing actions |
Engagement is the half that happens on the platform; the click to your site is the other half, and it needs its own tracking.
Reading Instagram, Facebook and LinkedIn engagement
On Instagram, saves and shares are among the strongest signs a post landed. A save means someone bookmarked it, and a share means they sent it to a friend in a DM.
On Facebook, the seven reactions (Like, Love, Care, Haha, Wow, Sad and Angry) all count as engagement. Read the mix: a post with high engagement made of Angry reactions has a different story than one made of Love.
LinkedIn's own guide to LinkedIn Page analytics places post effectiveness in the Content tab and opens those numbers to every Page admin role. Read a founder's Profile and the Company Page as two separate audiences.
Video platforms count time, not taps
On YouTube and TikTok, watch time is the engagement number that matters most, because every post is a video. Google's YouTube Analytics Engagement tab reports watch time and average view duration as its core measures.
Google Business Profile is the outlier. A listing has no followers graph and almost no likes, so its engagement shows up as customer actions, such as calls and direction requests.
The reach behind those differences is large. Pew Research Center's 2026 social media fact sheet counts 84% of U.S. adults on YouTube and 70% on Facebook, so most brands answer to several of these definitions at once.
How to calculate an engagement rate
An engagement rate turns raw engagement into a ratio, so a small account and a large one can be compared fairly. The most common method divides total engagements on a post by its reach or its impressions, then multiplies by 100.
That formula is a general convention, not a platform standard. Some teams divide by followers instead, which makes the rate look higher on accounts with low reach.
Pick one denominator, write it down and use it for every post, or the rate stops being comparable from month to month.
An illustrative calculation: a post shown 4,000 times that earns 60 likes, 12 replies and 8 reposts has 80 engagements, so its rate on impressions is 80 ÷ 4,000 × 100 = 2%.
A rate means little alone. The breakdown of a good engagement rate on X shows how to judge your number against your own past posts and your account size.
If you only need the number for one X account, the free tweet engagement rate calculator does the division for you from public post data.
The trend matters more than any single rate. A rate of 2% that climbs every month says more about your content than a rate of 4% that is slowly falling.
How Circleboom Publish measures engagement on every platform
Circleboom Publish gives every platform it supports the same Content Performance Analytics view, and only the platform's own engagement actions change from one screen to the next. You learn the layout once and read Instagram saves, Facebook reactions and X replies in the same place.
The view has three parts:
- Overview and Graphs: two selectable metrics (likes, comments, saves, shares, reach or impressions) charted together over 7D, 2W, 4W, 3M, 1Y or a custom range.
- Post Engagement Analytics: a sortable table of every published post, so the best and worst sit at the top and bottom.
- Video Analytics: a funnel from Started through 25%, 50%, 75% and 100% Watched.
The overview also shows the percentage change against the previous period. That single figure answers whether engagement is rising, without a spreadsheet.
The post table is where you see which posts earned the most engagement on each account, sorted by whichever action matters on that platform.
Engagement data from X in Circleboom Publish
X engagement inside Circleboom Publish comes from the same analytics that power Circleboom Twitter. Circleboom is listed on X's Enterprise customer directory, so the likes, replies and reposts you read come through approved access, not scraping.
That matters for engagement in particular. A scraped count can miss replies or lag behind the live number, and a rate built on an incomplete count is wrong before you start.
How to measure engagement on social media
To measure engagement on social media, read each post's actions against the signal its platform values most, convert them to a rate with one fixed denominator, and compare each period with the one before it. The four steps below run that routine for any mix of accounts.
- Pick one strongest signal per platform from the table above, such as saves on Instagram and replies on X, and write it next to each account.
- Sort the post table in Content Performance Analytics by that signal, and note the top three and bottom three posts.
- Calculate the rate for those six posts with the same denominator, reach or impressions, every time.
- Compare the period change in the overview with last month, and note which format moved the number.
That order works because it fixes the definition before the math. Once the signal and the denominator are set, every month's numbers measure the same thing, and a change in the rate reflects a change in the content.
At a glance: choose the signal, sort the posts, compute the rate, compare the period.
For an X-first account, the walkthrough on how to measure your Twitter engagement adds the habits that turn the numbers into more conversation.
Why is my social media engagement low?
Low engagement usually has one of three causes: posts go out when followers are offline, one format has stopped working, or the account's reach has been limited. Check them in that order, because each takes less effort than the next.
Podcast episode: seven common reasons engagement stalls on X, and the fix for each one, heard once the definition of engagement is pinned down.
Timing comes first. Circleboom's Best Time to Post reads the connected account's own followers and suggests the windows when they are online, instead of a generic chart averaged across millions of accounts. If your posts went out at random hours, start there.
Format comes second. Compare this month's top posts with last month's in the post table, and look for the format that slipped, such as carousels losing saves or videos losing viewers before the 50% mark.
On Instagram the causes have their own patterns, and the guide to why Instagram engagement is low walks through them one by one.
Reach comes last. A sudden, unexplained drop in reach on one platform while the others hold steady can signal a shadowban, and that needs checking before you change a single post.
What to do with your highest-engagement posts
Send them out again. Most of your followers never saw a given post the first time, and every follower who joined since has never seen it at all, so a proven post reaches a new audience with real data behind it.
Circleboom Publish does this with Repost From Sent Items. Sort the post table by your strongest signal, shortlist the posts that earned real engagement, then open the composer, pick the post in Sent Items and send it again as it is or edited.
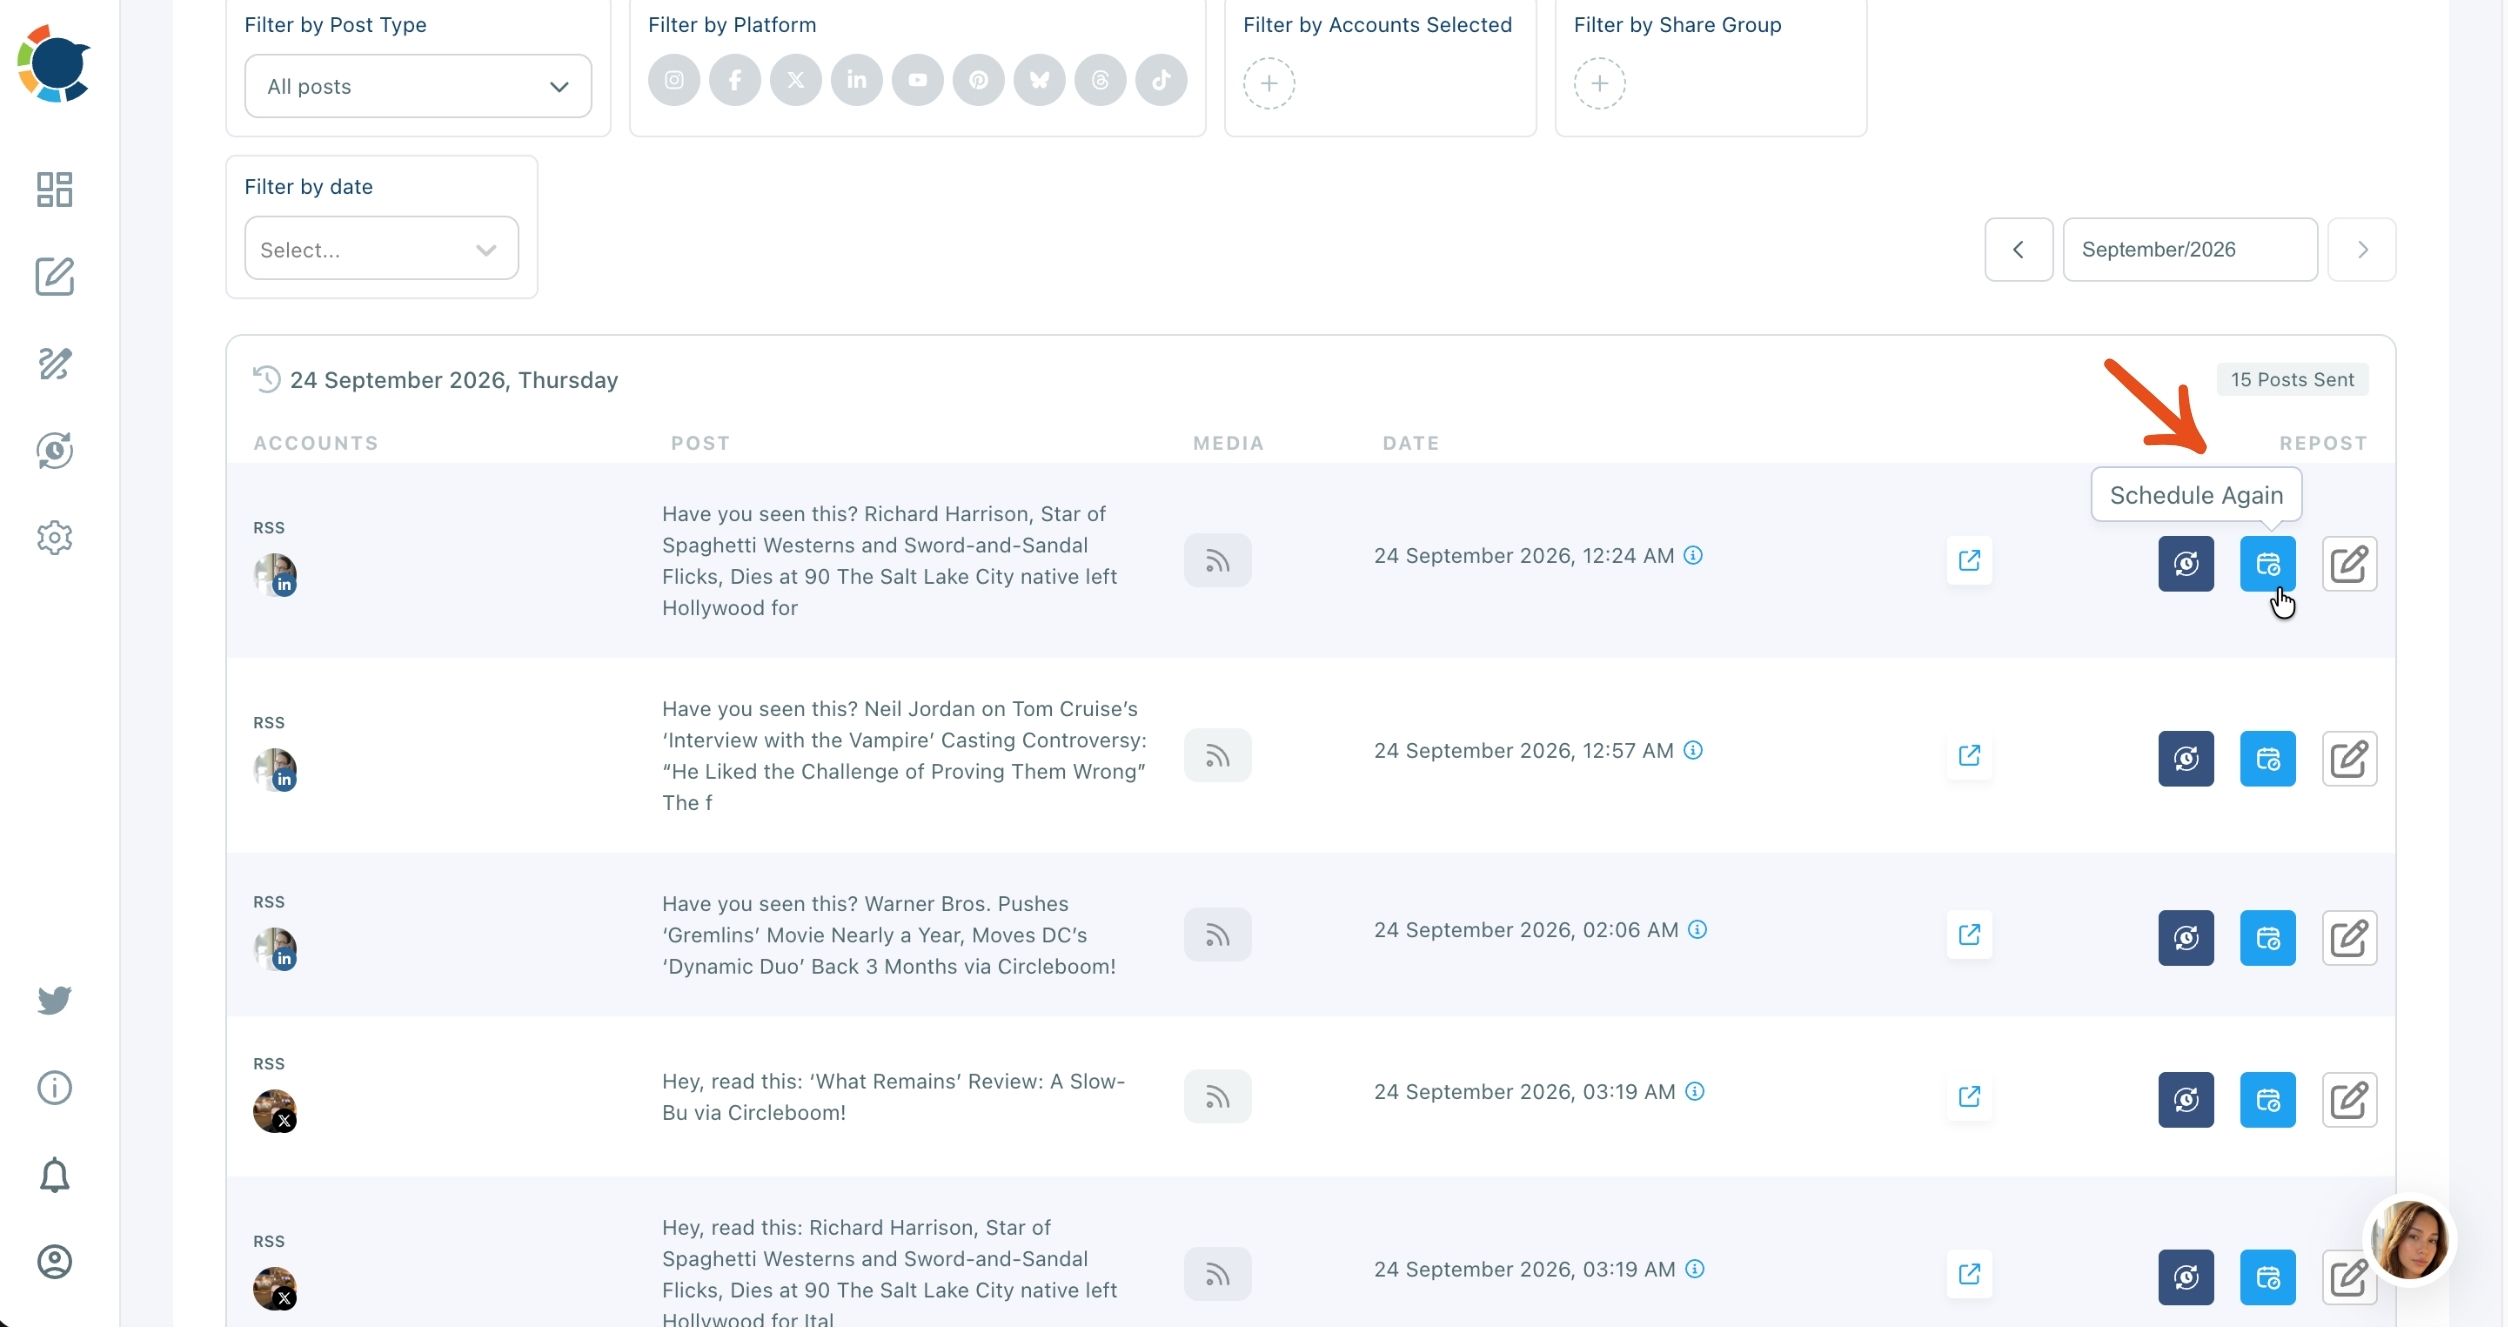
Refresh something small before you resend it, such as the hook, a number or the image, so the post reads as current. Space reposts out rather than sending the same content again within days.
The full loop, from finding the winner to putting it back on the calendar, is covered on the social media reposting page.
Engagement data picks the post; reposting turns one good result into a second one.
Summary: the definition of engagement in social media, in practice
Engagement on social media is every action people take on a post after they see it, and each platform counts its own version. Likes and replies lead on X, saves and shares on Instagram, reactions on Facebook, watch time on YouTube and TikTok, and customer actions on Google Business Profile.
Measure it against one signal per platform, divide by one fixed denominator, compare periods instead of totals, and reuse the posts that win. Circleboom Publish keeps that reading in one view for X, Instagram, Facebook, LinkedIn and the rest of your accounts.
→ Measure social media engagement across platforms
Engagement questions, answered
Is engagement farming worth it for more likes?
No. Bait posts that beg for replies or reposts inflate the count without building an audience that cares. The explainer on engagement farming on Twitter shows why X treats the tactic with suspicion.
Do link clicks count as engagement?
Some platforms count a link click as an engagement on the post, but what happens after the click lives in Google Analytics. Tag the link with Circleboom Publish's UTM Link Builder before posting, and Google Analytics shows which post brought the visit, the signup or the sale.
Can I compare engagement between two platforms?
Compare each platform with its own past results, not with each other. A 2% rate on X and a 2% rate on Instagram are built from different actions, so the useful question is whether each one is rising.